← Britannica Capital · Research & Intelligence
Correlation Mechanics

When All Assets Move Together

Correlation shocks are abrupt, state-dependent changes in cross-asset co-movement during stress. They simultaneously reduce independent bets, impair liquidity, and invalidate VaR assumptions — transforming diversified portfolios into concentrated exposures.

Leverage & Liquidity

The Deleveraging Feedback Loop

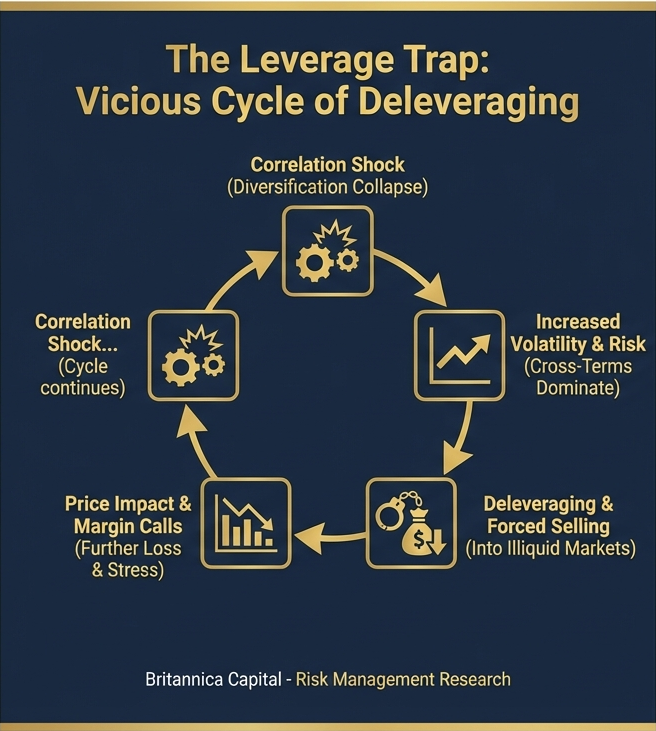
Crowded positioning and common financing channels create reflexive spirals: forced selling triggers price impact, which increases measured risk, which triggers further margin-driven deleveraging — compressing diversification precisely when it matters most.

Model Limitations

VaR Fails Under Regime Shifts

Traditional risk models calibrated on stable-period data systematically understate tail risk during correlation shocks. Gaussian copulas, static covariance matrices, and backward-looking VaR break down when the dependence structure itself becomes unstable.

Enhanced Framework

Beyond Traditional Risk Tools

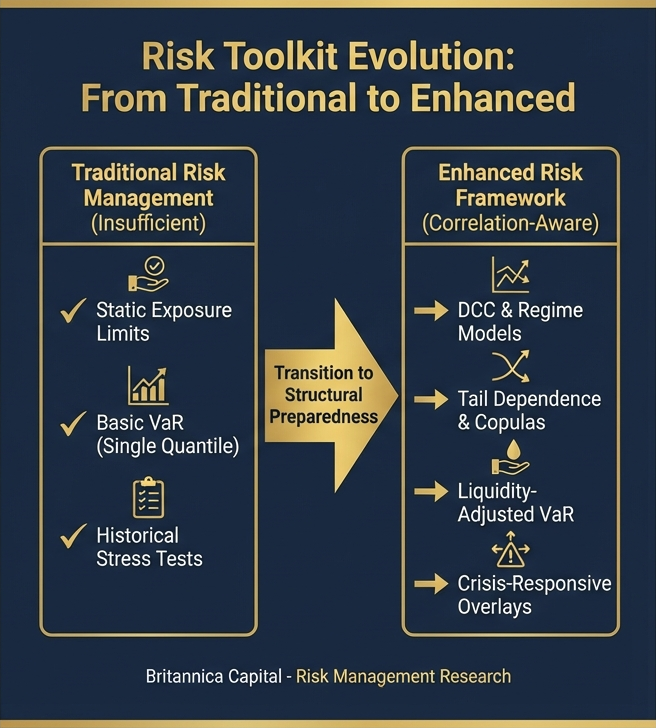
Robust management requires layered defences: dynamic correlation modelling, stressed dependence copulas, liquidity-adjusted constraints, crowding diagnostics, and convex crisis-responsive overlays — implemented with pre-committed decision rules.

Video Content
Video briefings and risk framework walkthroughs will be available here. Content is currently in production and will be published upon completion.
Executive Summary

Correlation shocks are abrupt, state-dependent changes in the dependence structure across assets, sectors, or strategies — most commonly a rapid increase in cross-asset co-movement during stress, the so-called "correlations go to one" phenomenon. They are not merely a statistical nuisance: they are an amplifier of drawdowns because they simultaneously reduce the number of independent bets in the book, impair liquidity precisely when leverage and margin constraints tighten, and invalidate model assumptions embedded in VaR, covariance estimates, and factor decompositions.

For hedge funds, the failure mode is often structural. Crowded positioning and common financing channels create a feedback loop in which deleveraging causes price impact, which increases volatility and measured risk, which triggers further deleveraging — compressing diversification benefits across nominally distinct trades. Correlation risk must be managed as a regime risk and a liquidity-and-funding risk, not merely as a covariance input problem. The 2026 experience to date — a crowded unwind in March, a rate-repricing shock in June, and long-end Treasury stress into September, with the stock-bond correlation still positive — is a reminder that every channel described here remains live.

01
Macro Factor Dominance
Risk-on/risk-off regimes force exposure to the same global factor, erasing apparent diversification
02
Funding Constraints
Margin calls and haircut increases force simultaneous deleveraging across trades sharing financing channels
03
Crowded Unwinds
Common factor exposures across managers create synchronized selling — the Aug 2007 quant meltdown archetype, echoed in March 2026
04
Liquidity-Induced Correlation
Execution through a single constrained liquidity channel makes idiosyncratic trades behave as macro trades
01
The Problem

Why Diversification Fails
When It Is Most Needed

The procyclical nature of correlation-based portfolio construction

Diversification is fundamentally a claim about independence: if return drivers are not perfectly correlated, adverse outcomes in one sleeve can be offset elsewhere. In practice, portfolio construction operationalizes this claim through correlation and covariance estimates — sample covariance, factor covariance, shrinkage estimators — and risk aggregation frameworks such as VaR, tracking error, and component risk contributions.

Correlation shocks attack this foundation in a nonlinear way. When correlations rise, portfolio variance can increase more than proportionally because risk is not simply the sum of standalone volatilities — cross-terms dominate. In crowded, levered books, this is compounded by financing dynamics: higher volatility raises margins and haircuts, tightens risk limits, and forces sales into illiquid markets.

The result is a regime where diversification becomes procyclical — it appears strongest in calm markets and weakest during crises. Academic evidence is consistent with "state-dependent dependence": correlations and co-movements intensify in extreme markets, and tail dependence can be materially higher than implied by linear correlation measured in normal times.

The Core Failure Mode

Correlation shocks cause the effective number of independent risk factors in the portfolio to collapse — often simultaneously with a deterioration in the liquidity needed to reduce exposure. The result is a portfolio that is both riskier and harder to exit than pre-shock metrics indicated.

Stylized Facts

Tail dependence exceeds center: Longin & Solnik (2001) show equity correlations in extremes differ materially from average correlations.

Downside asymmetry: Ang & Chen (2002) document stronger co-movement in down markets than up markets — standard Gaussian models miss this entirely.

Linear correlation is incomplete: A portfolio can show low unconditional correlation yet exhibit strong joint tail outcomes — the copula literature's central insight.

02
Definitions

What Correlation Shocks Are
(and What They Are Not)

Formal Definition

A correlation shock is a rapid change in co-movement — often a jump upward — across assets or strategies, typically triggered by macro stress, funding shocks, or synchronized risk reduction. Formally, if returns have covariance matrix Σt and correlation matrix ρt, a correlation shock is a discontinuous or regime-like change in ρt over a short horizon, causing the effective number of independent risk factors to collapse.

It is important to distinguish correlation (linear dependence) from dependence structure — which includes tail dependence and nonlinear co-movement — and to separate true dependence shifts from measurement artifacts driven by volatility changes and statistical conditioning.

A recurring pitfall: interpreting higher observed correlations as "contagion" when part of the increase is mechanical. Correlation is conditional on volatility and can be biased upward in stressed periods if not adjusted for heteroskedasticity — the central insight of Forbes & Rigobon (2002).

Shock vs. Drift — A Critical Distinction

Correlation drift is a gradual, regime-consistent evolution of co-movement that risk models can adapt to over time.

A correlation shock is a discontinuous, regime-changing event. It arrives faster than rolling-window estimates can adapt, invalidates pre-existing hedges, and typically coincides with the liquidity deterioration that makes repositioning most costly.

Managing for drift with static limits and rolling VaR is necessary but structurally insufficient for shock scenarios. The risk management framework must be explicitly designed for discontinuity.

03
Causation

Shock Mechanisms:
Why Correlations Jump

Correlation shocks typically arise from one or several overlapping channels. Understanding the specific channel active in a given stress event matters for both hedging design and governance response — the appropriate intervention differs depending on whether the driver is macro-factor dominance, a funding spiral, crowded positioning, or microstructure breakdown.

Common macro factor dominance (risk-on / risk-off) — In stress, a small number of global factors dominate cross-sectional dispersion: growth scares, inflation shocks, policy shifts, USD funding stress. Cross-asset sensitivity to the same factor rises even if exposures appeared diversified in benign regimes. Diversification that was real in normal conditions becomes illusory.
Funding and margin constraints (the liquidity spiral) — When volatility rises or funding tightens, prime brokers increase margins and haircuts. Funds reduce gross and net exposures simultaneously, creating co-movement across trades that share financing or risk limits. Brunnermeier & Pedersen (2009) formalize how market liquidity and funding liquidity reinforce each other in spirals that can accelerate rapidly.
Crowding and coordinated deleveraging — Where multiple managers share common factor exposures — value/quality, carry, short volatility, credit beta — shocks trigger synchronized unwinds. The August 2007 quant meltdown is the canonical case: crowded long/short equity positions experienced sharp correlated losses amid liquidity stress, despite appearing "market neutral" in normal conditions.
Microstructure and liquidity-induced correlation — As bid-ask spreads widen and order book depth evaporates, price impact rises and idiosyncratic trades become macro trades because execution is dominated by liquidity conditions rather than fundamentals. Returns may become more correlated simply because markets are clearing through the same constrained channel.

2026 Year to Date: Three Episodes, Three Channels

Each of the channels above has been observable in 2026. The three episodes below are summarised from public market data as of 1 September 2026; they are illustrative of the mechanisms and are not a complete catalogue of the year's stress events.

Episode Window Dominant Channel Observed Signature
Geopolitical escalation & crowded unwind March 2026 Macro factor dominance → coordinated deleveraging Following the outbreak of the Iran war on 28 February and Iran's formal announcement on 4 March of the closure of the Strait of Hormuz, the S&P 500 fell roughly 8.7% peak-to-trough (25 Feb to 30 Mar) and the VIX closed at 31.05 on 27 Mar, the 2026 high to date (both per FRED, series SP500 and VIXCLS); one-month S&P 500 implied correlation rose from roughly 15 at end-February to around 40 by late March (Cboe COR1M, as reported by Resonanz Capital); the hedge fund industry recorded its weakest month since January 2022, with fundamental long/short books losing mid-single digits across regions while systematic long/short was marginally positive (per Reuters reporting of a Goldman Sachs prime-brokerage note) — dispersion of outcomes characteristic of a crowded unwind rather than a pure beta event
Rate-repricing & concentration shock 5 June 2026 Macro factor dominance (policy / rates) Driven by a hot labor-market report and sudden AI-sector anxiety, June 5, 2026 marked one of the sharpest single-day tech declines of the year, pushing the Nasdaq down 4.2% and the S&P 500 down 2.6%, while sparking a rotation into defensive value sectors (the Dow closed up on the day); Nasdaq and S&P 500 moves per FRED (NASDAQCOM, SP500); VIX closed at 21.51 (FRED VIXCLS) — a reminder that concentrated index leadership makes "diversified" equity exposure a single-factor bet
Long-end Treasury stress August – early September 2026 Funding / duration; positive stock-bond co-movement 30-year Treasury yield reached about 5.3% in August (5.31% close on 17 Aug per FRED DGS30; characterised by Cboe as the highest since 2007) and the 10-year closed at 4.79% on 1 Sep (FRED DGS10); per Cboe, the MOVE index reversed lower readings to about 73 (54th percentile) in the week of 24 Aug; the VIX rose from its 2026 low of 14.25 (14 Aug) to 16.34 on 1 Sep (FRED VIXCLS) as equities and Treasuries sold off together; the Treasury announced a doubling of its buyback programme in the same week, as noted in Cboe's commentary
Regime Snapshot — As of 1 September 2026

Stock-bond correlation remains positive. The trailing 12-month correlation of daily total returns between the S&P 500 and the Bloomberg US Aggregate Index stood at +0.25 as of 27 May 2026, per State Street Global Advisors (SSGA), and the joint equity-and-Treasury sell-offs of late August and 1 September are consistent with that reading persisting. Volatility is low but no longer falling: the VIX closed at 16.34 on 1 September and 15.20 on 2 September, off the 14.25 low of 14 August (FRED VIXCLS); the MOVE index sits in the low-to-mid 70s (per Cboe). The framework reads this as an inflation-and-issuance regime rather than a growth-shock regime — the configuration in which duration is an unreliable hedge for equity risk and in which a correlation shock propagates through rates and funding as readily as through equity beta. Stress libraries calibrated only on 2008- or 2020-style "bonds rally when stocks fall" episodes are incomplete for this environment.

04
Hedge Fund Vulnerability I

Leverage:
Diversification Collapse Under Gross Exposure

Hedge funds often operate with meaningful gross leverage — in long/short equity, relative value, macro, and credit — or with implicit leverage via short volatility, carry, and credit spread exposures. In normal markets, leverage is tolerable because diversification and liquidity allow risk to be recycled across positions. In a correlation shock, two things happen simultaneously.

First, effective diversification collapses: the number of genuinely independent bets in the book shrinks as previously uncorrelated positions begin moving together. Second, risk per unit of gross rises: cross-terms dominate the covariance matrix, so portfolio volatility increases even if single-name volatilities do not rise proportionally.

Because leverage transforms small forecasting or estimation errors into P&L volatility, a correlation shock converts model risk into solvency risk rapidly — especially if risk limits and margin agreements are tied to recent realized volatility or rolling VaR, which are themselves slow to update.

The Leverage Trap

Static leverage limits calibrated in benign conditions can leave a fund overexposed at precisely the moment correlation shocks compress the independence between positions. A book that was genuinely diversified at 5× gross leverage may behave like a concentrated 10× book during a shock — before any explicit deleveraging has occurred.

Risk Limit Procyclicality

Margin agreements and risk limits tied to realized volatility or VaR have an inherent procyclical bias: they tighten precisely when the fund most needs flexibility, forcing deleveraging into stress at the worst price levels — amplifying rather than dampening the shock.

05
Hedge Fund Vulnerability II

Liquidity:
The Hidden Coupling Between Positions

Liquidity is not additive. In stress, liquidity often vanishes systemically — assets that were liquid in isolation become illiquid together. This is the "hidden correlation" of the book: positions may appear diversified in return space but are deeply correlated in liquidation space. When the exit door narrows, every position becomes part of the same trade.

Three compounding effects drive this dynamic. Time-to-liquidate risk increases as volumes drop — reducing risk requires more days, extending exposure to adverse price moves and forcing execution at worse prices. Nonlinear market impact produces convex execution costs as positions must be sold into a thin order book. And investor redemptions can force asset sales at precisely the wrong time, turning a manageable liquidity challenge into an existential one.

The Brunnermeier & Pedersen (2009) liquidity spiral captures the mechanism precisely: funding constraints impair market-making capacity, which worsens market liquidity, which increases margins and further constrains funding. Each turn of the spiral tightens the others.

The practical implication is that liquidity risk assessment must move beyond position-level bid-ask spreads. A portfolio's true liquidity profile is determined by the correlation of its liquidation channels — whether positions can be unwound independently or whether they must compete for the same buyers in the same stressed market simultaneously.

Key Insight — Diversification in Returns vs. Liquidation

Many "diversified" books fail not because positions are correlated in normal conditions, but because they are correlated in liquidation channels. A portfolio that holds equities, credit, commodities, and volatility may appear fully diversified in return space — and yet, in a correlation shock, all four may need to be sold simultaneously through illiquid markets. The risk that matters is not the return correlation but the liquidation correlation.

06
Hedge Fund Vulnerability III

VaR Limitations:
Endogeneity and Tail Dependence

VaR frameworks — parametric, historical, or Monte Carlo — are widely used for limit-setting and risk budgeting. Correlation shocks reveal their structural weaknesses, not as a critique of the tool per se, but as a warning against treating VaR as a sufficient risk measure for levered, crisis-exposed books.

VaR Weakness Mechanism Consequence During Correlation Shock
Non-stationarity Rolling window calibrated in calm markets underweights crisis dependence Risk appears low precisely when it is highest; limits remain too loose
Endogeneity Risk estimates influence behavior (deleveraging), which changes the distribution being estimated Models amplify the shock: measured risk rises → forced selling → prices fall further
Gaussian tail assumption Linear correlation and normality miss tail dependence and downside asymmetry Joint extreme outcomes are systematically underestimated; fat-tail events appear as "10-sigma" surprises
Procyclicality Allowed leverage rises in calm periods, encouraging build-up of risk that is then unwound in stress Deleveraging is forced into the worst liquidity conditions, amplifying drawdowns
Single quantile focus VaR communicates nothing about loss severity beyond the threshold Tail severity — the most relevant metric for survival — is invisible in standard VaR reporting
Danielsson's Endogeneity Critique

Market data is endogenous to market behavior. Risk models estimated in stability can fail precisely in crises — not because the math is wrong, but because the behavior of market participants responding to those models changes the distribution the models were built on. A VaR limit that triggers deleveraging by enough funds simultaneously is not measuring risk; it is creating it.

07
Hedge Fund Vulnerability IV

Operational Plumbing:
Margin, Basis & Financing Concentration

Correlation shocks rarely arrive in isolation from plumbing shocks. The operational and financing infrastructure around a portfolio typically tightens simultaneously with the market stress — often creating "hidden correlation" across strategies through shared financing channels, even where the underlying asset exposures appear diversified.

The practical implication is that operational risk assessments — prime broker concentration, repo funding stability, derivative margin profiles, cross-currency basis sensitivity — are not separate from correlation risk management. They are part of the same framework. A strategy that appears uncorrelated with the rest of the book may become the most correlated position in a stress scenario if it shares a funding channel that gets impaired.

Common Plumbing Shock Channels

Prime broker margin calls and increased haircuts — often intraday, forcing rapid gross reduction across the entire book regardless of position merit.

Repo market tightening — reduces the ability to fund leveraged fixed income and credit positions, forcing sales into stressed markets.

Cross-currency basis moves — impair FX-hedged positions and create unexpected P&L in seemingly hedged books.

Derivative initial margin increases — through CCP margin model updates, creating cash calls that must be met regardless of portfolio liquidity.

Reduced dealer balance sheet intermediation — limits the ability to execute large trades without significant market impact.

08
Risk Toolkit — Part I

Traditional Techniques:
Necessary but Insufficient

Exposure Limits & Risk Budgets

Gross/net limits, sector and issuer limits, factor exposure caps, and stop-loss rules remain foundational. However, static limits are vulnerable if factor mappings are unstable across regimes — a "market neutral" book can become implicitly long liquidity and short volatility in stress, making its nominal neutrality illusory precisely when the label matters most.

VaR as First-Order Constraint

VaR is useful as a common language for risk aggregation and a first-order constraint. It must be complemented with regime-aware overlays to avoid procyclicality and tail underestimation — it is the floor of the risk framework, not the ceiling.

Stress Testing — The Most Direct Antidote

Stress testing is the most direct response to correlation shocks because it does not rely on "average" dependence assumptions. An effective stress library includes cross-asset risk-off shocks (equity down, credit spreads wider, vol up, USD up, funding tighter), inflation and rates shocks (curve steepeners/flatteners, duration-convexity effects, and the 2026 configuration in which equities and long-dated Treasuries sell off together), liquidity freeze scenarios (spread widening plus execution haircuts), and crowded-factor reversals (value crash, momentum crash, carry unwind).

The limitation: stress tests become check-the-box exercises if scenarios are stale or not mapped to current positioning and financing. They must be live documents, reviewed against the actual book regularly.

09
Risk Toolkit — Part II

Enhanced Techniques:
Tailored to Correlation Shocks

Covariance Modeling

Regime-Aware Correlation Estimation

Dynamic Conditional Correlation (DCC) models estimate time-varying correlations, allowing dependence to evolve rather than remain fixed. Regime-switching covariance forces explicit modeling of correlation jumps. Best practice: maintain both a baseline and a stressed covariance matrix, and allocate risk capital against the worse of the two for fragile books.

Tail Modeling

Beyond Linear Correlation

Copula-based dependence and tail dependence coefficients capture joint extremes that Gaussian assumptions miss (t-copula vs. Gaussian). Extreme Value Theory-informed dependence reflects the empirical finding that co-movement behaves differently in the tails. Downside conditional correlation metrics address the asymmetry documented by Ang & Chen.

Tail-Sensitive Measures

Stressed VaR, ES & Drawdown Limits

Stressed VaR calibrated to crisis windows, Expected Shortfall (CVaR) to capture tail severity beyond a single quantile, and drawdown constraints aligned with actual investor experience. A practical framing: any risk model that does not bound tail loss under plausible correlation spikes is incomplete for levered strategies.

Liquidity Risk

From VaR to Risk-to-Exit

Liquidity-Adjusted VaR penalizes positions by bid-ask spreads and depth, not just volatility. Time-to-liquidate (TTL) limits cap the fraction of average daily volume the portfolio requires to reduce exposure. Margin-at-Risk simulates margin increases under stress to verify financing capacity sufficiency when it is most needed.

Crowding Diagnostics

Factor Overlap & Common Unwind Risk

Monitor factor overlap across PM sleeves and risk models (style factors, carry, vol exposure, liquidity beta). Track crowding proxies including position concentration and similarity to peer exposures. Use robust or stressed measures of strategy-return correlations. The August 2007 experience — and its March 2026 echo, when one-month S&P 500 implied correlation rose from roughly 15 to around 40 within weeks (Cboe COR1M, as reported by Resonanz Capital) and fundamental long/short books lost mid-single digits (per Reuters reporting of a Goldman Sachs prime-brokerage note) — shows correlated losses can emerge from crowded positioning even among ostensibly market neutral portfolios.

Hedging Overlays

Crisis-Responsive Instruments

Convexity overlays (index puts, put spreads, variance swaps with disciplined carry budgeting) provide direct protection. Trend-following / time-series momentum overlays often perform when correlations rise and markets trend. Rates convexity and correlation-sensitive instruments (dispersion strategies) can complement, subject to regime conditions — March 2026 showed how quickly a short-correlation position inverts when implied correlation jumps. Governance is critical: overlays must be sized to survive carry bleed and not cut before they pay.

The Governance Imperative for Hedging Overlays

The single most common failure in overlay programs is premature removal: overlays are cut during extended calm periods when carry costs accumulate and their value is not immediately visible. Effective governance requires pre-committed sizing and retention rules that survive the behavioral pressure to reduce bleed during calm regimes — precisely the conditions that precede the correlation shocks the overlays are designed to protect against.

10
Implementation

A Practical Framework:
Three Layers, One Dashboard, Committed Governance

A robust operational framework for managing correlation shocks integrates measurement, monitoring, and pre-committed governance into a single system. Each component is necessary; none is sufficient alone. The measurement layer must be multi-dimensional. The monitoring layer must provide early warning before a shock becomes a crisis. The governance layer must pre-commit actions so that process — not behavioral response under stress — drives decision-making.

Three Measurement Layers

Layer 1 — Statistical Correlation (day-to-day)
DCC or rolling correlations detect drift and gradual regime change. Essential as a baseline but insufficient for shock management. Provides the "normal state" benchmark against which stress deviations are measured.
Layer 2 — Conditional / Downside Correlation (stress-sensitive)
Correlations conditional on equity drawdowns, volatility spikes, or credit spread widening. Reflects the asymmetry documented empirically: co-movement is materially stronger in down markets. This is the layer most relevant for stress testing design.
Layer 3 — Tail Dependence / Liquidation Correlation (survival)
Stress correlation matrices, EVT-informed dependence, and liquidity coupling — time-to-liquidate, margin stress, and financing channel correlation. This layer addresses whether the portfolio can survive a shock, not merely how large the drawdown is.

Early Warning Dashboard

Market Signals

Realized cross-asset correlation and dispersion — Implied correlation indices (e.g., Cboe COR1M / COR3M) — Volatility regime (implied and realized; VIX and MOVE together) — Funding and liquidity indicators (bid-ask spreads, depth, repo stress proxies) — Credit spread moves and skew levels — Rolling stock-bond correlation and its sign

Portfolio / Internal Signals

Rising factor concentration (effective number of bets declining) — Increasing overlap across PM sleeves — Growth in required liquidation days — Margin sensitivity under stress scenarios

Pre-Committed Governance Actions

De-risking ladders tied to liquidity and margin — not VaR alone. Intraday risk and collateral monitoring for levered books. Reverse stress tests: "What scenario causes a breach of financing capacity?" — then hedge or reduce ex ante. Kill-switch rules for strategies prone to crowded unwind dynamics.

11
Conclusion

Structural Preparedness
for Predictable Unpredictability

"Correlation shocks are predictable in kind — they happen during stress — but difficult to forecast in timing. The correct response is therefore structural: treat correlation as regime-dependent, model dependence beyond linear correlation, and design governance that prevents procyclical deleveraging."
Britannica Capital Risk Research — September 2026
Measurement

Dynamic & Stressed Dependence Modeling

Maintain regime-aware covariance estimation, tail dependence measures beyond linear correlation, and a stressed covariance matrix as a parallel risk capital constraint for fragile books. The baseline and the stress case must both be live.

Risk Constraints

Tail-Sensitive & Liquidity-Adjusted Limits

Complement VaR with Expected Shortfall, drawdown limits, and Liquidity-Adjusted VaR. Time-to-liquidate constraints and margin-at-risk simulations convert abstract risk metrics into operationally binding constraints that reflect the true cost of exiting positions in stress.

Governance

Pre-Committed Decision Rules

Correlation shocks are as much a process problem as a modeling problem. Pre-defined de-risking ladders, kill-switch rules, and overlay retention commitments must be in place before the shock arrives — because the behavioral and financing dynamics that drive correlation shocks will also impair the quality of real-time decision-making.

The Integrated Risk Management Imperative

Traditional tools — VaR, exposure limits, and basic stress tests — remain necessary but are structurally insufficient when diversification fails. Robust risk management under correlation shocks requires a layered approach: dynamic and stressed dependence modeling, tail-sensitive risk measures, liquidity-adjusted constraints, crowding diagnostics, and convex or crisis-responsive overlays — implemented with pre-committed decision rules that are resilient to the very behavioral and financing dynamics that drive the shocks they are designed to manage.

References

Sources & Citations

1
Longin, F. & Solnik, B. — "Extreme Correlation of International Equity Markets." Journal of Finance (2001). Tail dependence exceeds center-of-distribution dependence in equity markets.
2
Ang, A. & Chen, J. — "Asymmetric Correlations of Equity Portfolios." Journal of Financial Economics (2002). Downside co-movement materially stronger than upside; Gaussian models fail to capture this.
3
Forbes, K. & Rigobon, R. — "No Contagion, Only Interdependence: Measuring Stock Market Comovements." Journal of Finance (2002). Heteroskedasticity bias in correlation-based contagion tests.
4
Embrechts, P., McNeil, A. & Straumann, D. — "Correlation and Dependence in Risk Management: Properties and Pitfalls." (2002). Copula framework; linear correlation as incomplete risk descriptor.
5
Engle, R. — Dynamic Conditional Correlation (DCC) framework. Time-varying correlation estimation with tractable parameterization for practical implementation.
6
Brunnermeier, M. & Pedersen, L.H. — "Market Liquidity and Funding Liquidity." Review of Financial Studies (2009). The liquidity spiral mechanism: funding and market liquidity reinforce each other in stress.
7
Danielsson, J. — "The Emperor Has No Clothes: Limits to Risk Modelling." (2001/2002). Endogeneity of market data; models estimated in stability fail in crises through behavioral feedback.
8
Khandani, A. & Lo, A. — "What Happened to the Quants in August 2007?" (NBER/MIT, 2008). Crowded long/short equity, coordinated deleveraging, and correlated losses in ostensibly market neutral portfolios.
9
Bangia, A., Diebold, F., Schuermann, T. & Stroughair, J. — "Modeling Liquidity Risk…" (1999/2001). Liquidity-Adjusted VaR incorporating bid-ask spread and market depth.
10
Basel Committee on Banking Supervision (BCBS) — Basel 2.5 / stressed VaR framework. Regulatory rationale for crisis-period calibration of VaR models post-2008.
11
Federal Reserve Bank of St. Louis (FRED) — Series VIXCLS, DGS10, DGS30, SP500, NASDAQCOM. Daily data through 2 September 2026, retrieved 3 September 2026. Source of VIX closes, Treasury yields and index moves cited in the 2026 episodes table.
12
Cboe Global Markets — "Week of 8/24/2026: Cross-Asset Volatilities Rise as Treasury Endeavors to Avert Yield Contagion." Cboe Insights (August 2026). MOVE index level and percentile, VXTLT, Treasury buyback commentary, and the characterisation of the August 2026 30-year Treasury yield as the highest since 2007 (yield levels themselves per FRED, ref. 11).
13
State Street Global Advisors — "Rising Yields Reshape Markets." Mind on the Market (1 June 2026). Trailing 12-month stock-bond correlation of +0.25 (S&P 500 vs. Bloomberg US Aggregate, daily total returns, as of 27 May 2026).
14
Reuters — "Hedge funds face worst monthly drawdown in over four years, Goldman Sachs tells clients" (1 April 2026), reporting a Goldman Sachs prime-brokerage note on March 2026 hedge fund performance by strategy and region. Source of the "weakest month since January 2022" characterisation.
15
Resonanz Capital — "After the Correlation Shock: How March 2026 Broke — and Reshaped — a Popular Vol Trade" (21 April 2026), citing Cboe Global Markets data on the S&P 500 implied correlation index (COR1M) and the dispersion index (DSPX).
16
CNN Business — Market coverage of the 5 June 2026 session (5 June 2026). Narrative context only (labor-market report, AI-sector sell-off, rotation into defensive value sectors, Dow closing higher); index magnitudes taken from FRED (ref. 11).
About This Note

This report is educational market research prepared by Britannica Capital Research for institutional readers. It is provided for informational purposes only and does not constitute investment advice, a recommendation, an offer, or a solicitation to buy or sell any security. Any positioning frameworks, allocation ranges, or scenario outputs shown are illustrative analytical constructs; they are not a description of any Britannica Capital portfolio, position, or holding, and they are not advice to any reader. Third-party data and research are attributed to their sources and remain the property of those sources. Views are as of the date of publication and subject to change without notice. Past performance is not indicative of future results. Britannica Capital is a private investment management firm and is not a registered investment adviser.