A comprehensive analysis of IG and HY spread dynamics, the roughly $1.2 trillion leveraged-finance refinancing wall of 2027–2029 (per PitchBook LCD), covenant erosion risks, and illustrative positioning frameworks for institutional credit portfolios navigating late-cycle compression.
Published
September 2026
Coverage
Credit · Fixed Income · Leveraged Finance
Audience
Institutional Allocators
Spread Environment
Historic Compression, Fragile Foundations
After a war-driven widening in the first quarter, IG and HY spreads have retraced to near the year's tights, pricing in a benign outlook. Yet beneath headline levels, CCC spreads have widened to their widest of 2026 and the gap between spread compensation and fundamental risk is growing — a classic late-cycle signal.
Refinancing Wall
~$1.2 Trillion in Leveraged Maturities Ahead
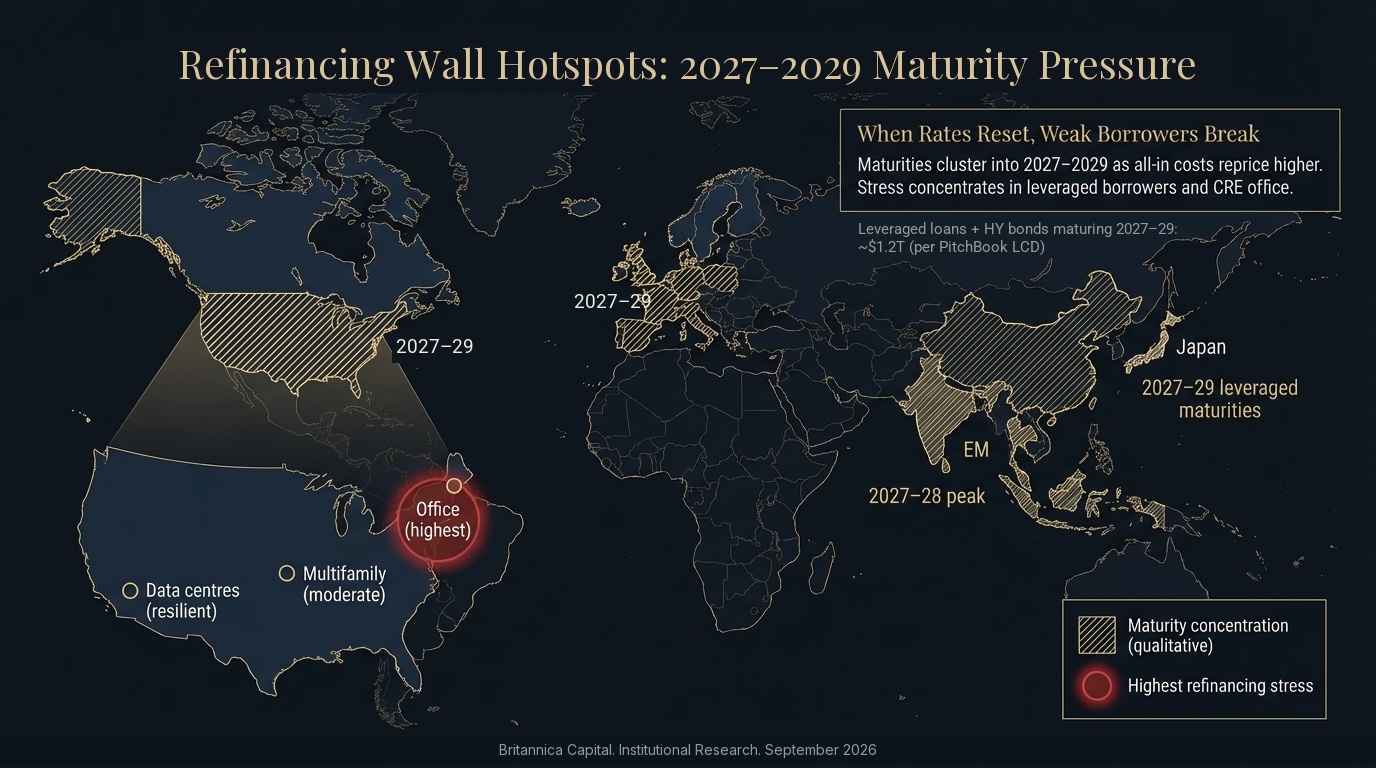
With 2026 maturities largely cleared, a concentrated wave of HY and leveraged loan maturities—roughly $1.2 trillion, per PitchBook LCD—hits between 2027–2029. Issuers that locked in low pandemic-era rates now face refinancing at materially higher coupons, creating a slow-burn stress mechanism even without recession.
Hidden Leverage
Covenant Erosion & Structural Risk
Years of covenant-lite issuance, EBITDA add-backs, and layered debt structures have obscured true leverage across the credit universe. Recovery rates in the next default cycle are likely to be materially lower than historical averages.
Tactical Positioning
Up-in-Quality, Selective Opportunity
The framework favours moving up in quality within IG, selective BB exposure in HY, and active avoidance of CCC-rated and covenant-lite structures. With the Fed on hold all year and a hike now debated, sector-level dispersion creates selection opportunities for credit pickers ahead of the maturity wave.
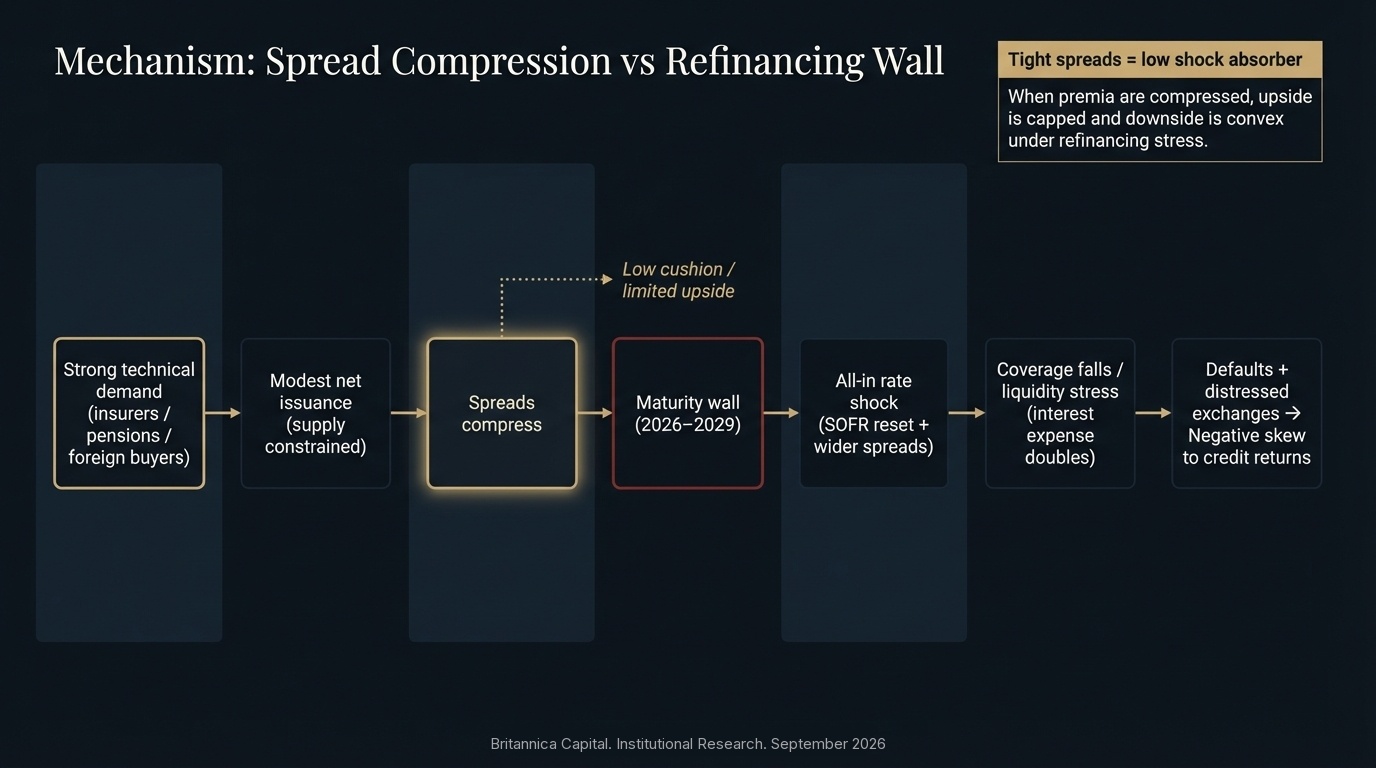
Spread Compression vs Refinancing WallTension between market pricing & fundamental pressure
▶
Video Content
Video briefings and credit market walkthroughs will be available here. Content is currently in production and will be published upon completion.
Executive Summary
Global credit markets entering September 2026 present a paradoxical landscape characterised by tight credit spreads coexisting with mounting refinancing pressures, a Federal Reserve that has held rates all year, and renewed geopolitical shocks. U.S. investment-grade corporate bond spreads stand at 81 basis points (ICE BofA via FRED)—having touched 73 basis points in January, the tightest reading in the ICE BofA series since 1998, and 94 basis points in March at the height of the Iran-war shock—while high-yield spreads trade at 266 basis points (ICE BofA via FRED), near their 2026 low and well below the 490 basis point historical average.
Simultaneously, corporate credit markets face a looming refinancing challenge. Over $1.5 trillion in commercial real estate loans mature across 2026–2027 (roughly $875 billion this year and $652 billion next, per the Mortgage Bankers Association), and while 2026 leveraged maturities have been largely refinanced or extended, approximately $1.2 trillion in leveraged loans and high-yield bonds mature between 2027–2029, per PitchBook LCD, creating significant rollover risk for highly leveraged borrowers facing substantially higher interest rates than when their debt was originally issued.
81bp
IG Corporate OAS
ICE BofA via FRED; 2026 range 73–94bp
266bp
High-Yield Spread
ICE BofA via FRED; vs. 490bp historical avg.
3.8%
Lev Loan Default Rate
Fitch TTM, July 2026; 4.5–5.0% YE forecast
~$1.2T
Leveraged Maturities
PitchBook LCD; 2027–2029 window
01
Current Environment
Credit Spread Compression
U.S. investment-grade corporate bond spreads stand at 81 basis points at the start of September 2026 (ICE BofA US Corporate Index via FRED), roughly 40 basis points tighter than three years ago. The year has been a round trip: spreads touched 73 basis points on 22 January—the tightest reading in the ICE BofA series since 1998—then widened to 94 basis points on 16 March after the Iran war that began on 28 February and Iran's formal announcement on 4 March that it was closing the Strait of Hormuz pushed oil sharply higher, with market stress peaking in late March; spreads then retraced almost fully once a ceasefire took hold in April. Compression has persisted despite above-target inflation, a Federal Reserve that has not cut rates in 2026, and a 10-year Treasury yield of roughly 4.8% on 1 September (FRED DGS10) as hostilities resumed.
The compression stems from multiple reinforcing factors: solid corporate fundamentals with debt-to-EBITDA ratios lower than 2015–2019 averages, strong technical support from insurance companies, pension funds, and foreign buyers, modest net new issuance relative to demand, and an investor base that has treated each shock as a buying opportunity.
However, these tight spreads present challenges. While all-in yields near 5.5% (ICE BofA US Corporate effective yield via FRED) appear attractive relative to the past 15 years, the risk premium component is minimal and the yield is now driven by Treasury rates rather than credit compensation. Historically, periods in which IG spreads have traded near the bottom of their range have tended to be followed by thin forward excess returns relative to periods of wider spreads.
IG Market Snapshot
IG Corporate OAS
81bp
BBB OAS
99bp
2026 Range (Low / High)
73 / 94bp
All-In Yield
5.5%
Source: ICE BofA US Corporate and BBB indices via FRED (OAS and effective yield as of September 2, 2026).
02
Sub-Investment Grade
High-Yield & Leveraged Loans
High-yield corporate bond spreads currently trade at approximately 266 basis points over Treasuries (ICE BofA US High Yield Index via FRED), compared to a 20-year average of 490bp. The index widened to 346bp on 30 March at the peak of the Iran-war sell-off—a move of roughly 50bp over late February and March, following the outbreak of war on 28 February and Iran's 4 March announcement closing the Strait of Hormuz—before retracing to 260bp on 28 August, the tightest level of 2026 in the series. Over three years the index has compressed by roughly 115bp, driven primarily by robust earnings growth, resilient corporate fundamentals among higher-quality issuers, and persistent investor appetite for yield; the all-in effective yield is now near 7.2% (ICE BofA via FRED).
The high-yield market's composition has improved meaningfully, with BB-rated issuers comprising roughly half of the index versus historical averages near 45%. However, this creates a somewhat misleading picture of overall market health, as the most vulnerable credits have migrated to leveraged loan markets or private credit, where covenant protections are weaker and transparency is lower. The bifurcation is visible within the bond index itself: CCC spreads have widened to over 1,000bp, their widest of the year, even as BB spreads sit near their lows (ICE BofA ratings-tier indices via FRED).
Rating Category
Current OAS
Historical Avg
Index Weight
Risk Assessment
BB (High Quality HY)
153 bps
285 bps
52%
Low Risk
Single-B (Core HY)
276 bps
515 bps
39%
Medium Risk
CCC & Lower (Distressed)
1,053 bps
1,250 bps
9%
High Risk
Overall High-Yield Index
266 bps
490 bps
100%
Cautious
Source: ICE BofA High Yield Indices via FRED (OAS as of September 2, 2026); historical averages and index weights per Bloomberg and Moody's Analytics.
Leveraged loan markets present a more concerning picture even as headline rates have eased. Fitch's trailing 12-month leveraged loan default rate stood at 3.8% in July 2026, down from a 5.9% peak in September 2025, yet Fitch still expects it to rise to 4.5–5.0% by year-end, well above the 3.4% historical average it cites. Private credit is running hotter still: Fitch's private credit default rate reached a record 6.1% in July, more than double the high-yield bond rate on Fitch's measure. The divergence reflects structural differences: weaker covenant protections, higher concentrations of lower-quality credits, and greater exposure to PE-backed borrowers with elevated leverage.
Critically, distressed exchanges and other out-of-court restructurings accounted for roughly two-thirds of defaults in 2025, per Fitch and Moody's—the highest share on record by their tallies—and remain the dominant form of default in 2026. Many exchanges result in substantial lender losses (40–60% recovery rates) but get counted as technical defaults rather than traditional bankruptcies. For investors, actual credit losses may be higher than headline default rates suggest.
03
Maturity Concentration
The Refinancing Wall
Through 2027: Largely Cleared
Loans Due by End-2027: $36.5B
Down From (End-2025): $61.9B
A&E Volume, Jan–May 2026: ~$79B
Index loans; PitchBook LCD, end-May 2026. Refi/repricing was ~70% of Q2 loan volume
2027–2029: The Wall
Leveraged Loans: ~$580B
High-Yield Bonds: ~$625B
Combined Leveraged: ~$1.2T
Per PitchBook LCD (Morningstar LSTA loan and Morningstar HY bond indices). 2028 is the steepest year
2029 and Beyond: The Push-Out
Added Since End-2025: +$89.5B
Loans Outstanding: ~$1.55T
Amendments Rated B- or Better: 71% (vs. 84% in 2024)
PitchBook LCD, end-May 2026. Extensions are increasingly sought by weaker borrowers; the wall is being moved, not removed
Refinancing Rate Shock
Typical 2021 Leveraged Loan: Base Rate (SOFR) near zero + Spread L+350 = All-In roughly 3.5%
Current Refinancing (Sept 2026): Base Rate (SOFR) 3.65% + Spread S+400 = All-In 7.65%
Borrowers face a 390 basis point increase in borrowing costs, roughly doubling interest expense. For a company with $500M in debt, this translates to an additional $19.5M in annual interest payments—a material burden that directly impacts cash flow available for operations, capital expenditure, and equity distributions. The relief that easing was expected to deliver has not arrived: the Fed has held the funds rate at 3.50–3.75% throughout 2026, three FOMC members dissented in July in favour of a hike, and markets have begun to price the possibility of tightening at the 15–16 September meeting.
Commercial Real Estate faces its own refinancing crisis. The Mortgage Bankers Association (MBA) estimates that roughly $875 billion—17% of the $5.0 trillion in outstanding commercial and multifamily mortgages—matures in 2026, with a further ~$652 billion due in 2027: over $1.5 trillion across the two years, per MBA. The office sector faces the most acute distress—the Trepp CMBS office delinquency rate rose to 11.91% in July 2026, near its all-time high on Trepp's series, while the overall CMBS delinquency rate climbed 51 basis points to 7.86% and multifamily reached 7.69%, a nine-year high, per Trepp. Trepp also reports that two-thirds of newly delinquent balances in July were non-performing maturity balloons—loans that simply could not refinance.
Property Type
Balances Maturing in 2026 (MBA)
CMBS Delinquency (Trepp, Jul 2026)
Distress Level
Outlook
Multifamily
13%
7.69%
Moderate
Occupancy sound; delinquency at a nine-year high as rate resets bite
Office
17%
11.91%
Severe
Structural demand decline; delinquency near record
Heavy 2026 maturities but robust demand and minimal delinquency
Hotel
30%
5.35%
Moderate
Largest share maturing; leisure outperforming business
Other (Healthcare, Self-Storage, etc.)
15% (healthcare)
—
Low–Moderate
Data centres exceptionally strong
Source: Mortgage Bankers Association, 2025 CREF Loan Maturity Volumes survey (share of each property type's outstanding balance maturing in 2026; published February 2026); Trepp CMBS delinquency report, July 2026. Dashes denote categories not broken out by the source.
04
Credit Cycle
Default Rate Outlook
Default rates across credit markets present a mixed picture. Headline rates have eased from their 2025 peaks: Fitch's trailing 12-month default rate stood at 2.7% for high-yield bonds and 3.8% for leveraged loans in July 2026, below the roughly 4% long-term speculative-grade average and well below recessionary peaks near 10–12%. Yet the easing is uneven. Private credit defaults hit a record 6.1% on Fitch's measure, and S&P Global Market Intelligence counted 372 large U.S. corporate bankruptcy filings in the first half of 2026—the highest first-half total since 2010—led by industrials, consumer discretionary and healthcare.
Forecasters had expected 2026 to bring relief from easier monetary policy; instead the Fed has held all year. Fitch's year-end 2026 forecasts remain 2.5–3.0% for HY bonds but 4.5–5.0% for leveraged loans—implying a re-acceleration from July's 3.8%—with telecom, technology and transportation expected to drive loan defaults. Moody's baseline for the U.S. speculative-grade rate was roughly 3% by October 2026. These projections assume no recession and were largely formed before the resumption of U.S.–Iran hostilities in September; a renewed oil shock or a Fed hike would push them higher.
Credit Cycle Assessment
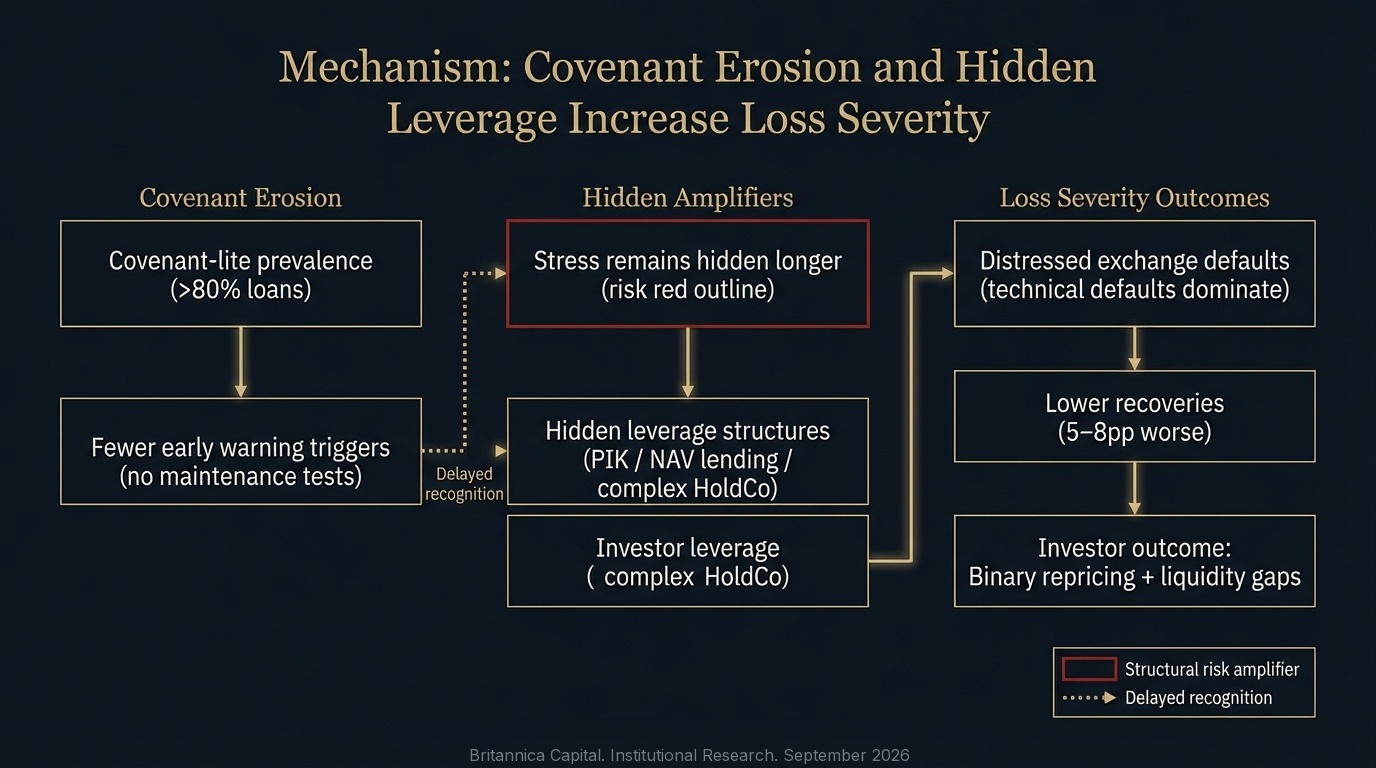
The current credit cycle exhibits unusual characteristics. Traditional metrics suggest mid-cycle positioning, but the magnitude of leverage accumulated during the ultra-low rate era creates tail risks that are not captured by standard models. The proliferation of covenant-lite structures (now over 80% of institutional leveraged loans) eliminates early warning systems, making defaults more binary and reducing lender recovery rates by 5–8 percentage points.
05
K-Shaped Credit
Sector Dispersion
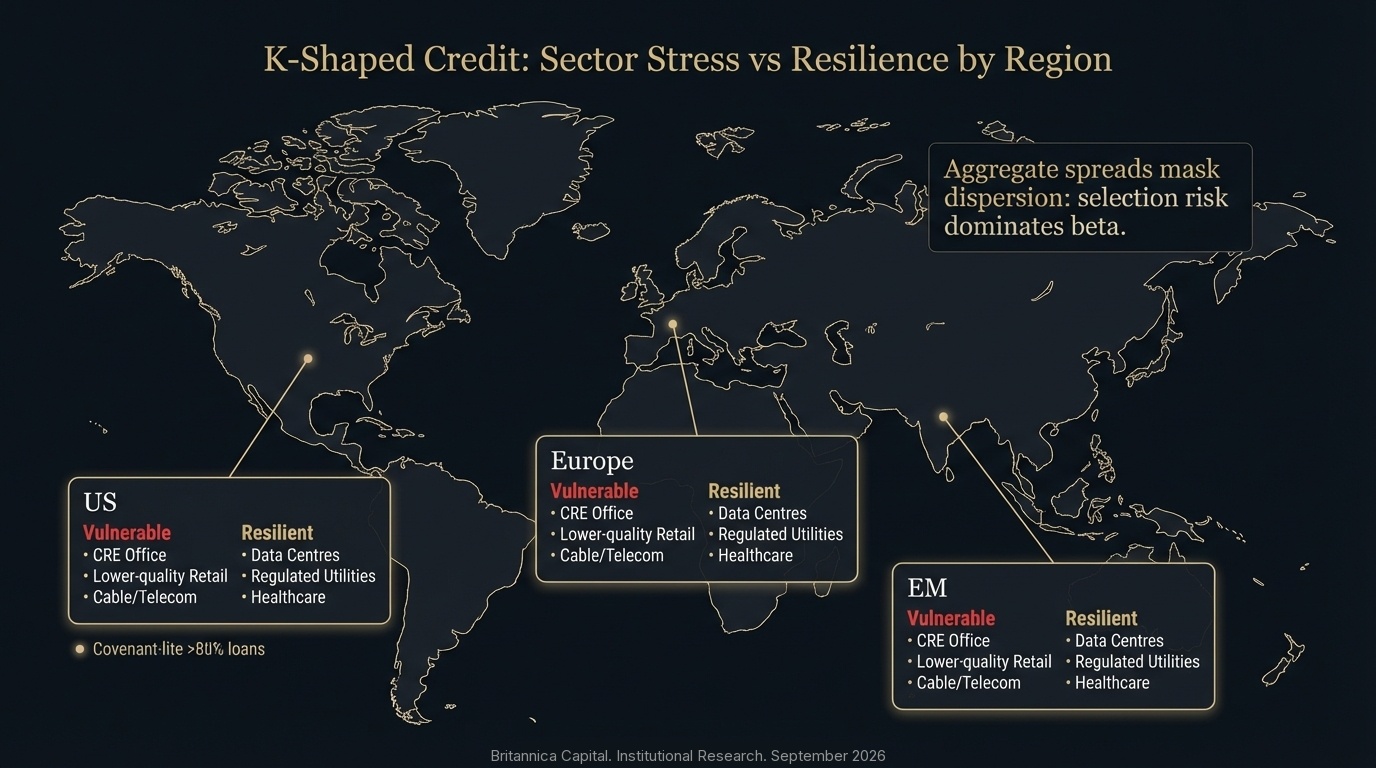
Credit quality dispersion across sectors has widened dramatically, creating a bifurcated environment where aggregate statistics mask substantial variance. 2026 added a new fault line: the February repricing of software equities on fears of AI-driven disruption spilled into leveraged loans, where sponsor-backed software issuers—one of the largest loan-index sectors—now face higher borrowing costs, stalled primary deals and amend-and-extend refinancings, even as capital has poured into AI data-centre and digital-infrastructure financings. Active management with rigorous bottom-up credit selection becomes essential to avoid concentration in vulnerable sectors while capturing opportunities in resilient areas.
High-Risk Sectors
CRE Office
Very High
Retail (Lower Quality)
High
Building Materials
High
Chemicals
Elevated
Consumer Discretionary (Lower Income)
Elevated
Cable / Telecom / Media
Elevated
Software (AI-Disrupted, Sponsor-Backed)
High
Resilient Sectors
AI Infrastructure / Hyperscaler Supply Chain
Very Low
Healthcare Services
Low
Data Centres
Very Low
Utilities (Regulated)
Very Low
Pharmaceuticals
Low
Industrial (Select)
Low
06
Structural Risks
Hidden Leverage & Covenant Erosion
A concerning development in credit markets is the proliferation of hidden leverage—debt structures that exist outside traditional financial statements. Payment-in-kind (PIK) debt, where interest is paid by issuing additional debt, and Net Asset Value (NAV) lending, where PE sponsors borrow against portfolio company value, have grown substantially.
The bankruptcies of Tricolor and First Brands in 2025 illustrate this dynamic. Both accessed hybrid public-private capital structures with significant hidden leverage. When operational challenges emerged, the cash flow burden triggered rapid deterioration that caught many investors by surprise. The pattern has continued into 2026: PIK income at the largest non-traded BDCs rose roughly 42% year over year in the first quarter, loans carrying a PIK component average around 16% of listed BDC portfolios, and Fitch's private credit default rate reached a record 6.1% in July—with 17 unique defaulters in that month alone, concentrated among smaller issuers lacking refinancing options.
Covenant-lite loans now comprise over 80% of the institutional leveraged loan market, up from less than 25% in 2013. Average recovery rates on defaulted covenant-lite loans are 5–8 percentage points lower than traditional loans, and restructuring timelines are longer due to reduced lender leverage.
Hidden Leverage Warning Signs
◆
PIK Toggle Features — Options to pay interest in kind rather than cash
◆
PE Ownership — Sponsor-backed companies face elevated NAV lending and dividend recap risk
Given the combination of tight spreads, mounting refinancing pressures, a Federal Reserve that may yet tighten, and elevated geopolitical uncertainty, the analysis favours a defensive, quality-focused approach to credit allocation through the remainder of 2026 and into 2027. The current environment rewards selectivity and risk management over broad market beta exposure.
Illustrative Credit Allocation Framework
IG Corporate Bonds — 10–15% of FI allocation (vs. 20–25% neutral). Quality bias: A/AA over BBB.
Underweight
High-Yield Bonds — 5–8% of FI allocation. BB heavy (70–80%); minimal CCC. Avoid 2027–28 maturities.
Neutral
Leveraged Loans — 3–5% of FI allocation. B+ or higher; prefer some covenant protection.
UW to Neutral
CLO Mezzanine — 3–5% of FI allocation. A/BBB tranches for yield with structure protection.
Tactical
EM Corporate Debt — 5–7% of FI allocation. IG heavy; Asia-focused with selective LatAm.
Positive
Risk Management Framework
01
Maturity Wall Tracking — Identify all holdings with 2027–2029 maturities; flag credits where coverage falls below 2.0x at current rates
Spread Duration Management — Monitor spread duration separately from rate duration; reduce via shorter maturities
06
Liquidity Stress Testing — Maintain adequate allocation to liquid IG and large-cap HY to preserve flexibility
08
Risk–Return
Scenario-Based Return Projections
To illustrate the risk-return trade-offs facing credit investors over the twelve months from September 2026, the analysis presents four illustrative scenarios with probability-weighted expected returns for major credit asset classes. The starting point differs from the beginning of the year: the Fed is on hold rather than easing, oil has re-emerged as an inflation risk, and spreads have already retraced the first-quarter widening.
Scenario
Prob.
Macro Conditions
Spread Movement
IG
HY
Loans
Base: Soft Landing
50%
GDP +1.5–2.0%; Fed on hold, at most one cut; oil stabilises
IG +10–15bp; HY +30–40bp
+4.5%
+6.2%
+5.8%
Bull: Strong Growth
20%
GDP +2.5–3.0%; durable Middle East ceasefire; robust earnings
IG -5bp; HY -15bp
+5.8%
+8.5%
+7.2%
Bear: Recession
25%
GDP -0.5 to -1.5%; oil-driven Fed hike then recession; defaults rise
IG +60–80bp; HY +150–200bp
+1.2%
-4.5%
-2.8%
Severe: Crisis
5%
GDP -2.0%+; credit market disruption
IG +120bp+; HY +400bp+
-2.5%
-15.0%
-12.0%
Probability-Weighted
100%
—
—
+3.6%
+2.9%
+3.0%
Source: Britannica Capital Research, September 2026. Illustrative 12-month total-return scenarios for broad market indices, including income and price appreciation/depreciation; not forecasts of any portfolio's performance.
Scenario Insights
Probability-weighted expected returns across credit segments are relatively modest—in the roughly 3–3.5% range—reflecting tight starting spreads and elevated downside risk. Return distributions are negatively skewed, with substantial downside in bear and stress scenarios partially offset by modest upside in bull scenarios. This asymmetry stems from compressed spreads that offer limited upside potential. Credit allocation should emphasise risk management and downside protection over return maximisation.
09
Conclusion
The Path Forward
"The credit cycle has not been repealed; it has merely been delayed and potentially amplified by years of ultra-accommodative policy. Positioning portfolios for resilience when the cycle inevitably turns should be the primary objective for institutional credit investors."
Britannica Capital Research, September 2026
The corporate credit markets in September 2026 present a challenging environment characterised by the uncomfortable juxtaposition of tight spreads and mounting structural risks. Investment-grade spreads at 81bp and high-yield spreads at 266bp (ICE BofA via FRED)—both in the bottom decile of historical ranges—offer minimal compensation for credit risk exposure, and the late-February-to-March episode showed how quickly a 50–80bp widening can arrive when a geopolitical shock meets a crowded market.
The remainder of 2026 and 2027 will likely be shaped by the interaction of several competing forces. The relief that Federal Reserve easing was expected to provide to floating-rate borrowers has not materialised: the funds rate has been held at 3.50–3.75% all year, SOFR sits near 3.65%, and the policy debate has shifted toward whether an oil-driven inflation impulse warrants a hike. The magnitude of maturing debt in 2027–2029, combined with refinancing costs that are no longer falling, creates structural headwinds that monetary policy is unlikely to offset in the near term.
Successful credit investing over the coming year will reward those who prioritise capital preservation and risk management over return maximisation. Building portfolios with quality bias, sector selectivity, maturity awareness, and adequate liquidity provides the foundation for navigating an environment where the risks of being wrong substantially exceed the rewards of being incrementally more aggressive.
Strategic Positioning Summary
◆
A Defensive Posture — Underweight credit risk vs. strategic allocations. Maintain exposure for income at reduced weights with quality bias.
◆
Emphasise Bottom-Up Selection — Sector and credit dispersion demand rigorous active management. Avoid vulnerable sectors; capture resilient opportunities.
◆
Monitor Maturity Walls — Systematically assess 2027–2029 maturity holdings. Eliminate exposure where refinancing at current rates is unsustainable.
◆
Scrutinise Hidden Leverage — Enhanced due diligence on corporate structure complexity, sponsor behaviour, and covenant modifications.
◆
Prioritise Liquidity — Allocate to liquid IG and large-cap HY segments. Limit illiquid private credit and complex structures.
◆
Diversify Beyond Traditional Credit — Consider EM debt, CLO mezzanine tranches, and floating rate instruments for better risk-adjusted outcomes.
Sources & Methodology
This report incorporates data and research from ICE BofA Indices via Federal Reserve Economic Data (FRED; option-adjusted spreads, effective yields, SOFR and Treasury yields as of September 1–2, 2026), the Federal Reserve (FOMC statement, July 29, 2026), Fitch Ratings (U.S. Corporate Distressed and Default Monitor for July 2026, published August 17, 2026; December 2025 default outlook), Moody's Ratings and Moody's Analytics (2026 leveraged finance outlook, November 2025; U.S. corporate default risk commentary, April 2026), S&P Global Market Intelligence (H1 2026 bankruptcy data, July 2026), PitchBook LCD (2026 U.S. distressed credit outlook; the 2027–2029 leveraged loan and high-yield bond maturity-wall figures, based on the Morningstar LSTA loan and Morningstar HY bond indices; amend-and-extend data through May 2026; Q2 2026 loan market review), Octus (H1 2026 leveraged finance primary review, August 2026), Mortgage Bankers Association (2025 CREF Loan Maturity Volumes survey, February 2026), Trepp (CMBS delinquency report, July 2026), Proskauer (Private Credit Default Index, Q1–Q2 2026), Neuberger Berman (Q2 2026 fixed income outlook), Bloomberg, and proprietary Britannica Capital analysis. Spread data reflect market conditions as of September 2, 2026; default statistics reflect the latest published trailing-12-month figures as of July 2026.
Important Disclosures
This research report is provided for informational purposes only and does not constitute investment advice, a recommendation, or a solicitation to buy or sell any securities. Past performance is not indicative of future results. All investments in fixed income securities involve risk, including interest rate risk, credit risk, and liquidity risk. High-yield securities involve greater risk of default and price volatility than investment-grade securities. Leveraged loans involve additional risks including covenant-lite structures, limited liquidity, and elevated default risk. The information contained herein is based on sources believed to be reliable, but Britannica Capital makes no representation or warranty as to its accuracy or completeness. The views expressed herein are those of the Britannica Capital Research as of September 1, 2026, and are subject to change without notice.
About This Note
This report is educational market research prepared by Britannica Capital Research for
institutional readers. It is provided for informational purposes only and does not constitute
investment advice, a recommendation, an offer, or a solicitation to buy or sell any security.
Any positioning frameworks, allocation ranges, or scenario outputs shown are illustrative
analytical constructs; they are not a description of any Britannica Capital portfolio, position,
or holding, and they are not advice to any reader. Third-party data and research are attributed
to their sources and remain the property of those sources. Views are as of the date of
publication and subject to change without notice. Past performance is not indicative of future
results. Britannica Capital is a private investment management firm and is not a registered
investment adviser.