← Britannica Capital · Research & Intelligence
Chokepoint Anatomy

Where Global Trade Is Most Fragile

Over 80% of global goods by volume pass through a small number of narrow maritime corridors. These chokepoints — once treated as reliable infrastructure — have become active vectors of geopolitical risk, inflationary pressure, and portfolio volatility.

Red Sea & Hormuz

Structural Disruption, Not Temporary Shock

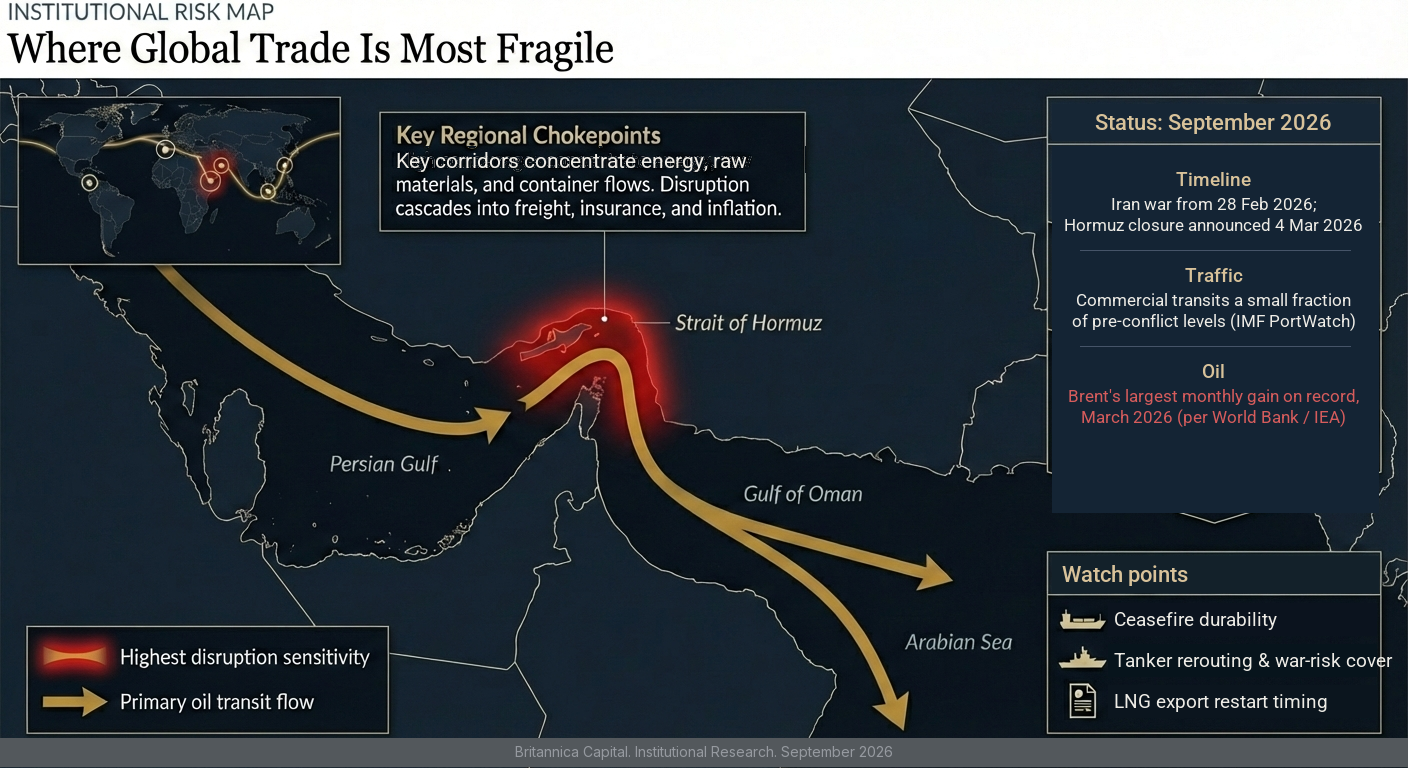
The Red Sea crisis is now in its third year as a structural reconfiguration of shipping networks, with Houthi attacks resuming in July 2026. Simultaneously, the Strait of Hormuz has been effectively closed to most commercial traffic since Iran formally announced its closure on 4 March 2026, days after the Iran war began on 28 February, in what the World Bank and IEA describe as the largest oil supply shock in history.

Inflation Transmission

From Freight Rates to Consumer Prices

Maritime disruptions transmit through freight rate spikes, insurance premium surges, inventory hoarding, and rerouting costs. US headline CPI reached 3.4% year on year in July 2026 with the energy index up 14.7%. These supply-side inflation shocks originating from chokepoints are no longer tail events — they are recurring features of the current regime.

Portfolio Implications

Positioning for Recurring Supply Shocks

Allocators must explicitly price chokepoint risk into portfolio construction. Defence, energy infrastructure, shipping equities, and commodity hedges offer structural exposure to a world built for efficiency now penalised for its lack of redundancy.

Video Content
Video briefings and geopolitical risk walkthroughs will be available here. Content is currently in production and will be published upon completion.
Executive Thesis

Over 80% of global goods by volume move by sea, and the vast majority of that trade passes through a small number of narrow maritime corridors. These chokepoints, once treated as reliable infrastructure, have become active vectors of geopolitical risk, inflationary pressure, and portfolio volatility.


The Red Sea crisis, now in its third year, is no longer an acute disruption. It is a structural reconfiguration of global shipping networks, and the Houthi blockade declared against Saudi-linked shipping in July 2026 has reversed much of the partial recovery seen earlier in the year. The Strait of Hormuz, which this report flagged in February as the principal escalation risk, has been effectively closed to most commercial traffic since Iran formally announced its closure on 4 March 2026, four days after the Iran war began on 28 February, with successive ceasefires failing to restore durable passage. The Panama Canal is again tightening draft limits as El Niño conditions build. Together, these disruptions expose a system built for efficiency that is increasingly penalised for its lack of redundancy.


For allocators and portfolio managers, the investment implication is clear: supply-side inflation shocks originating from maritime chokepoints are no longer tail events. They are recurring features of the current regime, and they demand explicit consideration in portfolio construction, sector allocation, and risk management.

$192B
Annual Trade Exposed
Nature Communications, 2026
~50%
Suez Transits Below Pre-Crisis
Suez Canal Authority, Q2 2026
~20%
Global Oil via Hormuz, Pre-Conflict
World Bank / EIA
-1.6M
bpd Global Oil Demand Change 2026
IEA Oil Market Report, Aug 2026
01
Strategic Geography

The Chokepoint Map:
Where Global Trade is Most Fragile

Global maritime trade depends on fewer than a dozen narrow passages. These corridors, some barely a few kilometres wide, funnel the energy, raw materials, and manufactured goods that sustain the global economy. When one is disrupted, the effects cascade: rerouting absorbs fleet capacity, freight rates spike, insurance premiums rise, and delivery timelines stretch, all of which feed directly into consumer prices and corporate margins.

The Suez Canal and its southern approach through the Bab el-Mandeb Strait historically carry roughly 12% to 15% of global maritime commerce, including a significant share of Asia-to-Europe container traffic and energy flows. The Strait of Hormuz carried roughly 20 million barrels per day before the conflict, approximately one-fifth of global petroleum liquids consumption, more than a quarter of seaborne oil trade and around 15% of global LNG trade, according to World Bank and EIA data. The Panama Canal, while smaller in trade share by weight, is critical for trans-American energy and container flows, particularly to the US East Coast.

What makes the current environment particularly consequential is the simultaneity of stress. Multiple chokepoints are under pressure at the same time, from different causes: renewed conflict in the Red Sea, the closure of Hormuz formally announced by Iran on 4 March 2026, and climate-driven draft restrictions at Panama. This convergence narrows the rerouting options available to shipping operators and compounds the inflationary impact.

Critical Maritime Chokepoints
Strait of Hormuz
~20% Global Oil / Closed
Bab el-Mandeb / Suez Canal
12-15% Global Trade
Strait of Malacca
25% Global Shipping
Panama Canal
5% Global Trade / Draft Cuts
Taiwan Strait
Strategic / Semi
Strait of Gibraltar
~28% World Trade
Exhibit 1
Global Maritime Chokepoints: Volume & Risk Assessment (September 2026)
PRE-DISRUPTION TRANSIT VOLUME (INDEXED) · RISK STATUS AS OF SEPTEMBER 2026Strait of HormuzCriticalStrait of MalaccaElevatedSuez Canal / Bab el-MandebHighPanama CanalElevatedTurkish StraitsModerateCape of Good Hope (reroute)ModerateCriticalHighElevatedModerateIran war from 28 Feb 2026; Hormuz closure announced 4 Mar 2026 (transits a small fraction of pre-conflict, per IMF PortWatch); Panama draft 47.5 ft from 3 Sep 2026 (ACP)
Source: UNCTAD Review of Maritime Transport, IMF PortWatch, Suez Canal Authority, Panama Canal Authority, EIA
Illustrative chart built from public data. Not investment advice; not a description of any Britannica Capital position.
02
Red Sea Crisis

From Acute Disruption
to Structural Reconfiguration

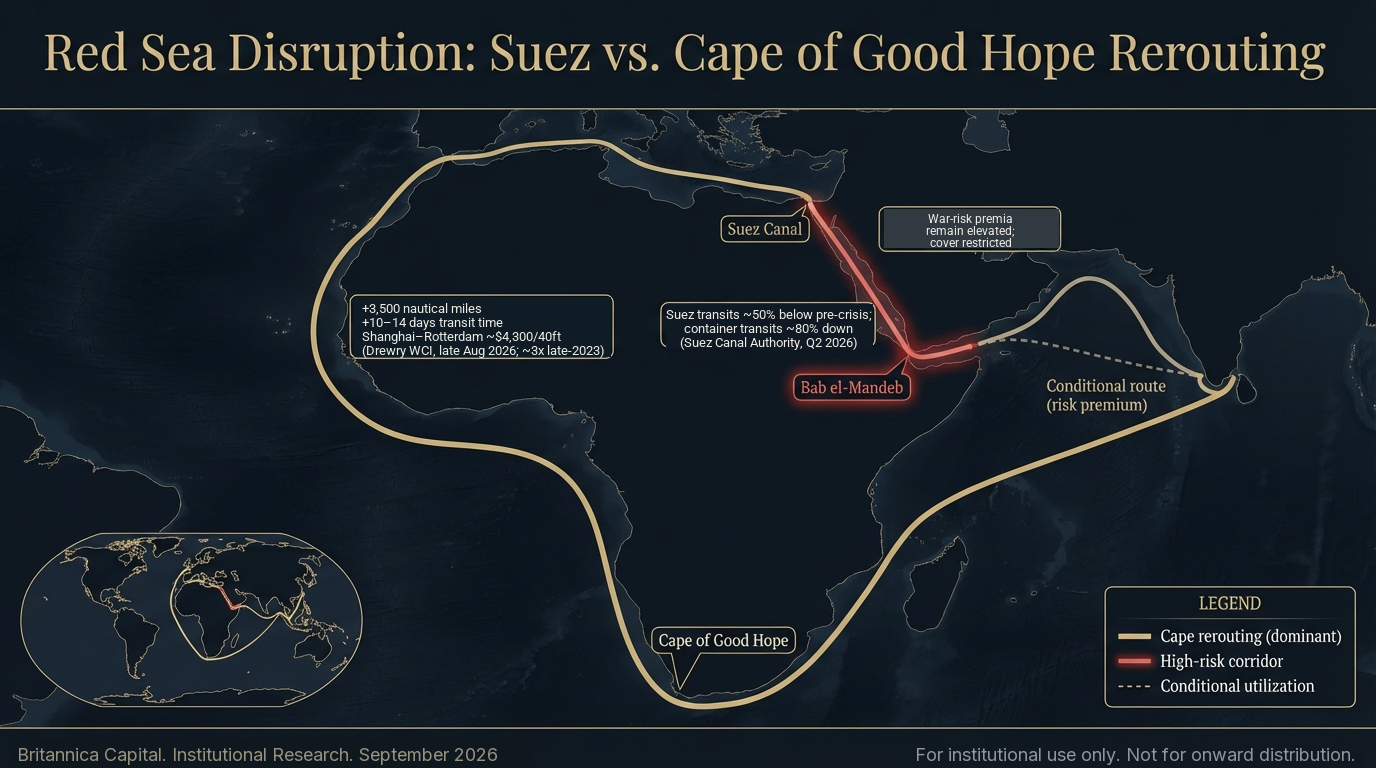
The Red Sea crisis has fundamentally altered global shipping networks. What began as a series of Houthi attacks on commercial vessels in late 2023 has evolved into a persistent reshaping of maritime trade routes. The partial recovery that followed the late-2025 operational pause ended on 20 July 2026, when the Houthis declared a maritime blockade against Saudi-linked shipping after the collapse of the UN-backed Yemen truce. Bab el-Mandeb transits fell roughly 24% in the following week, to about 266 to 269 vessels per week from 354 before the blockade, with mainstream tanker transits down about 42%. An attack on a vessel near the strait on 12 August killed six crew.

The shipping industry's response has been decisive and durable. The majority of container services continue to operate on Cape of Good Hope routing, a diversion that adds roughly 3,500 nautical miles and 10 to 14 days to Asia-Europe transit times. Cape traffic surged 191% above 2023 levels by 2024, and this routing has become embedded in carrier operating strategies regardless of formal threat assessments. Container transits through Suez were roughly 80% below pre-crisis levels in the second quarter of 2026, according to Suez Canal Authority figures reported in the trade press.

Suez Canal revenues, a critical indicator of corridor utilisation, tell a more nuanced story. Toll revenue rose quarter on quarter in the second quarter of 2026, according to Suez Canal Authority figures reported in the trade press, but the recovery was driven by crude tankers rerouted around the closed Strait of Hormuz rather than by a return of container traffic; overall transits remained roughly 50% below the pre-crisis run-rate on the same figures. The canal's status has shifted from a reliable, neutral corridor to what analysts now describe as a "conditional route", accessed selectively and with sustained risk premiums.

Cost Impact Assessment

Freight rates: Drewry's World Container Index put the Shanghai-Rotterdam rate at roughly $4,300 per 40ft container in late August 2026, about three times late-2023 levels, per Drewry.

Rerouting costs: Each Cape diversion adds materially to per-container costs through additional fuel, crew time, and operational expenses.

War risk insurance: Red Sea additional war-risk premiums remained elevated through mid-2026, and the Joint War Committee extended its listed area northward in August.

Aggregate impact: Sustained rerouting and elevated costs were imposing a multi-billion-dollar annual burden on global trade even before the Hormuz closure.

Structural Shift

The Red Sea has transitioned from a seamless, assumed-reliable corridor to a conditional route with permanent risk premiums. Even if hostilities fully cease, the return of pre-crisis traffic patterns will take years, not months. Carriers have invested in Cape-based scheduling, and insurance markets will maintain elevated premiums until confidence is durably restored.

Exhibit 2
Suez Canal Monthly Transit Volumes: January 2023 to August 2026
0255075100SUSTAINED REROUTING4 Mar 2026: Hormuz closure announcedJul 2026: Red Sea disruption renewedJan 2023Dec 2023Dec 2024Dec 2025Aug 2026INDEXTransits indexed to 2023 average = 100; monthly values interpolated between published quarterly and weekly totals
Source: Suez Canal Authority, IMF PortWatch, Lloyd's List Intelligence
Illustrative chart built from public data. Not investment advice; not a description of any Britannica Capital position.
03
Strait of Hormuz

The Oil Chokepoint:
From Escalation Risk to Closure

The Strait of Hormuz remains the single most consequential chokepoint for global energy markets. Before the conflict, roughly 20 million barrels per day, about one-fifth of global petroleum liquids consumption and more than a quarter of seaborne oil trade, passed through this narrow corridor connecting the Persian Gulf to the Indian Ocean, according to World Bank and EIA data. The disruption that this report treated as a tail risk in February has materialised, and its inflationary impact has dwarfed that of the Red Sea crisis.

The Iran war began on 28 February 2026, and on 4 March Iran formally announced the closure of the strait to commercial shipping. Commercial transits fell to a small fraction of pre-conflict levels within days, per IMF PortWatch; Brent crude crossed $100 per barrel on 8 March for the first time in four years and peaked at about $126, and in March 2026 Brent recorded its largest monthly gain on record, in what the World Bank and IEA describe as the largest oil supply shock in history. Successive arrangements, a ceasefire in April, a US-Iran memorandum in June, and an interim agreement in July, each broke down amid further attacks on shipping. As of late August 2026, IMF PortWatch data showed commercial transits still running at a small fraction of pre-conflict levels, the US Navy reported clearing more than 100 suspected mines, and Iran and Oman were negotiating the coordinates of a designated safe corridor. Hull war-risk premiums for Gulf transits remain many multiples of pre-conflict levels, and marine insurance cover for Gulf voyages has become materially harder to obtain.

Realised Risk

Closure Scenario, Six Months In

The closure this report framed as an extreme tail in February has now persisted for six months. Brent peaked at about $126 per barrel in the spring, fell back toward $80 in late June during the short-lived memorandum, and was trading near $90 to $93 at the end of August 2026. The IEA's August report projects global oil demand contracting by 1.6 mb/d in 2026 as high prices destroy consumption, with observed inventories falling 69 million barrels in July alone.

Active Risk

Fragile Corridor Arrangements

Three competing transit routes now exist: Iran's designated territorial-waters route, an IMO- and Oman-backed corridor along the Omani coast, and the pre-war lanes. Vessels using non-Iranian routes have been fired upon, and each incident has collapsed the arrangement in force. Mine clearance, blacklisting of vessels by Iran's new maritime authority, and the scarcity of insurance cover mean that a formal reopening would not translate into normal flows for months.

Structural Cost

Permanent War Premium

The geopolitical "war premium" embedded in energy pricing is no longer a temporary spike. It has become a permanent fixture of 2026 energy markets. Benchmark VLCC earnings on the Gulf-to-China route exceeded $480,000 per day in early August 2026, Qatar's LNG exports are running at roughly half of pre-conflict capacity, and Asian and European gas benchmarks remain well above their February levels. Insurance premiums, escort costs, and routing inefficiencies create a structural floor under energy prices regardless of supply/demand fundamentals.

"Even if aggregate supply remains adequate, the cost of moving that supply through contested corridors has permanently increased. The market is pricing security as a factor of production."
Britannica Capital Research, September 2026
04
Macro Transmission

How Chokepoint Disruptions
Feed Into Inflation

The transmission mechanism from maritime disruption to consumer prices is well-documented but frequently underestimated. Third-party sell-side research has estimated that the initial Red Sea disruptions alone could add 0.7 percentage points to global core goods inflation and 0.3 percentage points to overall core inflation. When sustained, as they have been, the cumulative impact is materially higher, and the Hormuz closure has added a direct energy channel on top: US CPI energy was up 14.7% year on year in July 2026, with gasoline up 24.6%, lifting headline inflation to 3.4%.

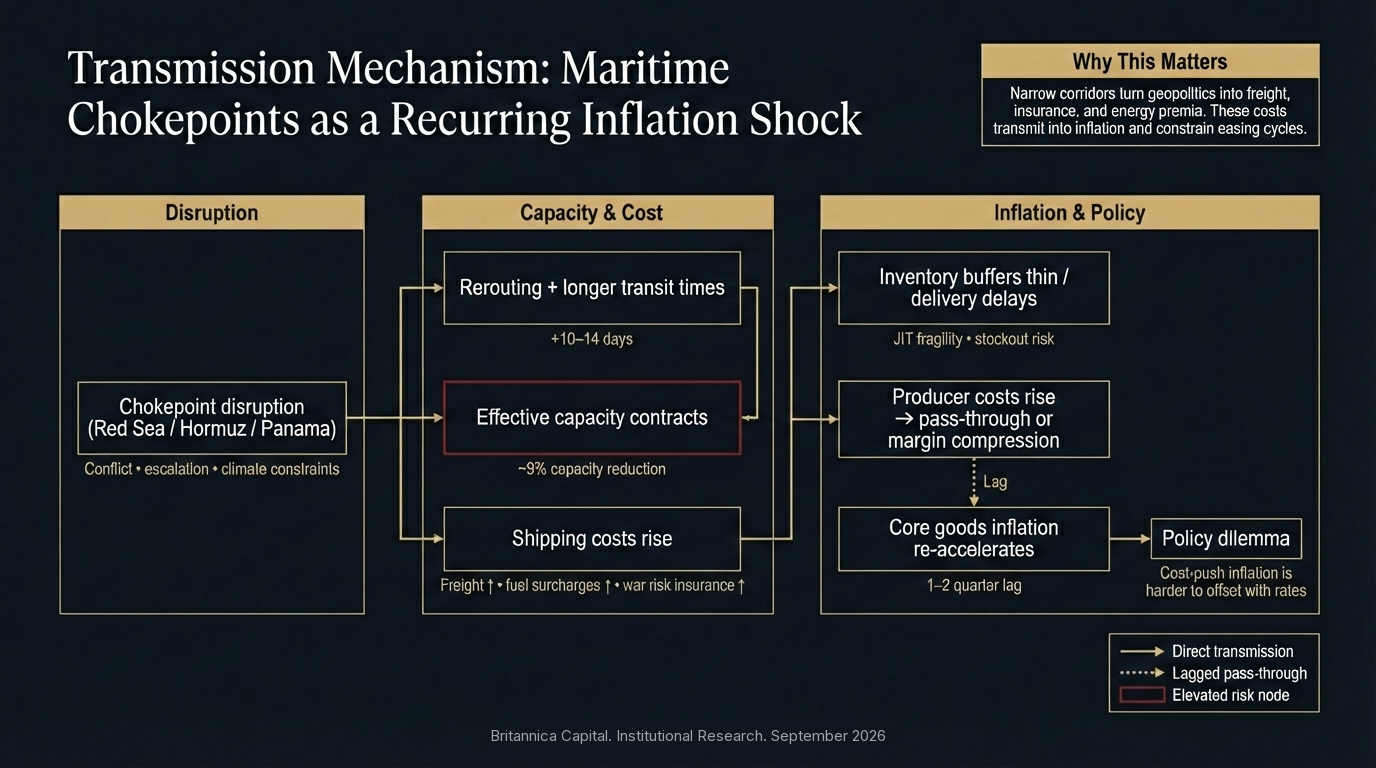
The mechanics are straightforward. Rerouting around the Cape of Good Hope reduces effective global container shipping capacity by approximately 9%, as vessels are tied up on longer voyages. This capacity reduction functions as an adverse supply shock. Delivery timelines stretch. Inventory buffers thin. Procurement costs rise. And those costs pass through to final goods prices with a lag of roughly one to two quarters.

Critically, this is supply-side inflation that monetary policy is poorly equipped to address. Central banks can tighten to dampen demand-pull inflation, but they have limited tools against cost-push inflation driven by shipping disruptions, energy price spikes, and insurance surcharges. The result is a policy dilemma: tighten further and risk demand destruction, or accommodate and risk de-anchoring inflation expectations.

Chokepoint disruption forces rerouting, absorbing fleet capacity and extending transit times by 10 to 14 days
Freight rates spike as effective capacity contracts; war risk insurance and fuel surcharges compound costs
Inventory buffers erode as delivery windows stretch; just-in-time supply chains face stockout risk
Producer costs rise across manufacturing, retail, and consumer sectors; margin compression or price pass-through follows
Consumer prices increase with a 1-to-2 quarter lag; core goods inflation re-accelerates, complicating central bank easing cycles
Key Inflation Indicators
US CPI Energy Index (Jul 2026)
+14.7% YoY
US CPI All Items (Jul 2026)
+3.4% YoY
Effective Capacity Reduction
~9%
Drewry WCI Shanghai-Rotterdam (late Aug 2026)
~$4,300 / 40ft
Exhibit 3
Freight Rate Indices vs. Core Goods CPI: January 2023 to August 2026
PASS-THROUGH LAGHormuz closure announced, Mar 20262023202420252026AugFREIGHT INDEXCORE GOODS CPI INDEXBoth series indexed to early 2023 = 100; scales differ. Freight through 3 Sep 2026; CPI through Jul 2026
Source: Drewry World Container Index, Shanghai Containerized Freight Index, Bureau of Labor Statistics
Illustrative chart built from public data. Not investment advice; not a description of any Britannica Capital position.
05
Scenario Framework

What to Watch:
Three Paths Forward

Base Case

Persistent Disruption, Contained Escalation

A negotiated corridor through Hormuz is agreed in the fourth quarter of 2026 and flows recover gradually through 2027, but insurance, mine-clearance and vessel-blacklisting frictions keep transits well below pre-conflict levels for months. Red Sea routing via Cape of Good Hope remains the norm. Brent settles in the $80 to $95 range with a persistent geopolitical premium. Headline inflation stays above target on the energy channel while core goods pass-through builds with a lag. Central banks hold, with a bias toward tightening rather than easing.

Adverse Scenario

Prolonged Closure, Multi-Chokepoint Stress

Hormuz remains effectively closed into 2027. The Houthi blockade of Saudi-linked shipping widens. Panama draft limits fall further as El Niño strengthens through the 2026-27 dry season. Global observed inventories, already below 7.9 billion barrels, keep drawing at July's pace, lifting Brent back above $100 to $120. Core inflation re-accelerates by 0.5 to 0.8 percentage points, central banks resume tightening, and equity markets reprice rate expectations.

Tail Risk

Renewed Military Escalation

A breakdown of the current standoff leads to renewed large-scale strikes, attacks on Gulf export infrastructure, or Iranian mining of the Omani-coast corridor. Brent retests or exceeds the spring peak of about $126, moving toward $130 to $150 per barrel. Global manufacturing faces an immediate input cost shock. Consumer-facing sectors absorb severe margin compression. Central banks face an impossible tradeoff between inflation control and recession prevention. Equity markets enter correction territory.

Red Sea Return Timeline - The partial return of Suez traffic anticipated for mid-2026 did occur in tanker volumes, but the July 2026 Houthi blockade has pushed container normalisation out again. Full normalisation now looks unlikely before 2027 at the earliest.
Hormuz Reopening Signals - Watch for a signed Iran-Oman corridor agreement, daily transit counts on IMF PortWatch recovering sustainably toward pre-conflict levels, completion of mine clearance, the restoration of normal marine insurance cover, and the lifting of Iranian vessel blacklists.
Insurance Market Behaviour - War risk premiums are a leading indicator. A sustained fall in Gulf hull war-risk premiums from their current elevated levels back toward pre-conflict norms would signal that underwriters, not just diplomats, believe the corridor is reopening.
Central Bank Language - Any shift in Fed or ECB communications toward acknowledging supply-side inflation as a binding constraint would mark a regime change for rate expectations.
06
Investment Implications

Positioning for
Maritime Risk

Maritime chokepoint risk is no longer a background variable. It is a first-order consideration for portfolio construction across equities, fixed income, commodities, and alternatives. The regime we are operating in, where multiple chokepoints face simultaneous stress from different drivers, requires explicit mapping of supply chain exposure and energy cost sensitivity across portfolio holdings.

The key insight for allocators is that the inflationary impact of these disruptions is asymmetric and sector-specific. Upstream energy producers, shipping operators, and defence contractors benefit directly from elevated prices and increased demand for security services. Consumer-facing sectors, manufacturers with lean inventory models, and businesses with high freight cost sensitivity bear the burden disproportionately.

The Federal Reserve held its target range at 3.50% to 3.75% at its July 2026 meeting, with three dissents in favour of a rate increase and minutes attributing part of the inflation overshoot to "higher energy and input costs stemming from the conflict in the Middle East". Market pricing has moved from anticipating cuts in 2026 toward the possibility of hikes. Policymakers recognise the challenge of supply-side inflation but have limited tools to address it, leaving rate expectations vulnerable to further upside surprises from energy and freight cost shocks, a dynamic that directly impacts duration positioning and equity multiples.

Sector Exposure Framework
Upstream Energy (Americas)
Beneficiary
Shipping / Tanker Operators
Beneficiary
Defence / Maritime Security
Beneficiary
European Retailers
Margin Pressure
Auto / Manufacturing
Input Cost Risk
Consumer Discretionary
Inventory / Cost Risk
Portfolio Construction Considerations

Traditional inflation hedges (commodities, TIPS, real assets) offer partial protection but miss the sector-specific dispersion. Effective positioning requires a dual approach: direct exposure to beneficiary sectors where pricing power accrues from disruption, combined with underweighting or hedging sectors with high freight sensitivity, thin inventory buffers, and limited ability to pass through costs. Duration positioning should account for the risk that supply-side inflation constrains the pace and depth of central bank easing, potentially steepening the yield curve beyond current market pricing.

07
Conclusion

The New Cost
of Global Trade

"The era of frictionless global shipping is over. Maritime chokepoints have transitioned from background infrastructure to active risk factors, and the cost of that transition is being paid in inflation, margin compression, and portfolio volatility."
Britannica Capital Research, September 2026

The evidence is unambiguous. Maritime chokepoint risk has moved from the tail to the body of the distribution. The Red Sea crisis has demonstrated that non-state actors with relatively modest capabilities can structurally disrupt global trade. The Strait of Hormuz has now been effectively closed for six months, an outcome that sat in the tail of this report's February scenario framework and has since become the base case. The Panama Canal's vulnerability to climate-driven constraints, with draft limits cut to 47.5 feet from 3 September 2026, adds a third vector of disruption that operates on a different timeline but compounds the same inflationary pressures.

For portfolio managers and allocators, this regime demands a shift in analytical frameworks. Supply chain geography, freight cost sensitivity, inventory resilience, and energy cost exposure are no longer secondary considerations. They are primary drivers of relative performance across sectors and geographies. The firms and portfolios that will navigate this environment most effectively are those that have mapped these exposures explicitly, rather than treating them as generic macro risks.

The appropriate investment stance is one of active monitoring, explicit sector tilts toward beneficiaries of disruption, and disciplined hedging of freight-sensitive exposures. This is not a temporary dislocation. It is the new cost of global trade.

Final Assessment

The probability of a return to pre-2023 shipping normalcy within the next 12 to 18 months is low, and lower than it appeared in February. Even a formal reopening of Hormuz would leave insurance, mine-clearance and fleet-positioning frictions in place for months. The geopolitical drivers of disruption are structural, not cyclical. Portfolio positioning should reflect a regime where the geopolitical premium on energy and freight is a permanent feature, not a transient distortion awaiting mean reversion.

Important Disclosures

This material has been prepared by Britannica Capital for informational purposes only and does not constitute investment advice or a recommendation, offer to sell, or solicitation of an offer to buy any security or interest in any investment vehicle. Any such offer will be made only by a confidential offering memorandum and only to qualified investors. Past performance is not necessarily indicative of, or a guarantee of, future results. All investments involve risk, including the possible loss of principal. Strategies discussed in this report may involve exposure to commodities, energy markets, shipping equities, and geopolitically sensitive regions, all of which carry elevated volatility and concentration risk. Any projections, targets, or forward-looking statements regarding energy prices, freight rates, or inflation trajectories are based on assumptions and are subject to change; actual results may differ materially, and no assurance is provided that any stated objectives will be achieved. References to indices, freight rate benchmarks, or commodity prices are for illustrative comparison only; indices are unmanaged and not directly investable. Information herein, including data on chokepoint volumes, transit costs, and insurance premiums, is sourced from third parties believed to be reliable, but no representation or warranty is made as to its accuracy or completeness. Opinions reflect the judgment of Britannica Capital as of the date indicated and are subject to change without notice. Any hypothetical or scenario-based analysis has inherent limitations and does not reflect actual trading, fees, expenses, or market impacts.

About This Note

This report is educational market research prepared by Britannica Capital Research for institutional readers. It is provided for informational purposes only and does not constitute investment advice, a recommendation, an offer, or a solicitation to buy or sell any security. Any positioning frameworks, allocation ranges, or scenario outputs shown are illustrative analytical constructs; they are not a description of any Britannica Capital portfolio, position, or holding, and they are not advice to any reader. Third-party data and research are attributed to their sources and remain the property of those sources. Views are as of the date of publication and subject to change without notice. Past performance is not indicative of future results. Britannica Capital is a private investment management firm and is not a registered investment adviser.