How Markets Price Conflict
A quantitative framework for measuring how equity, fixed income, commodity, and currency markets incorporate geopolitical uncertainty into asset prices — from sanctions transmission and supply shock dynamics to options-implied tail risk and portfolio hedging strategies.
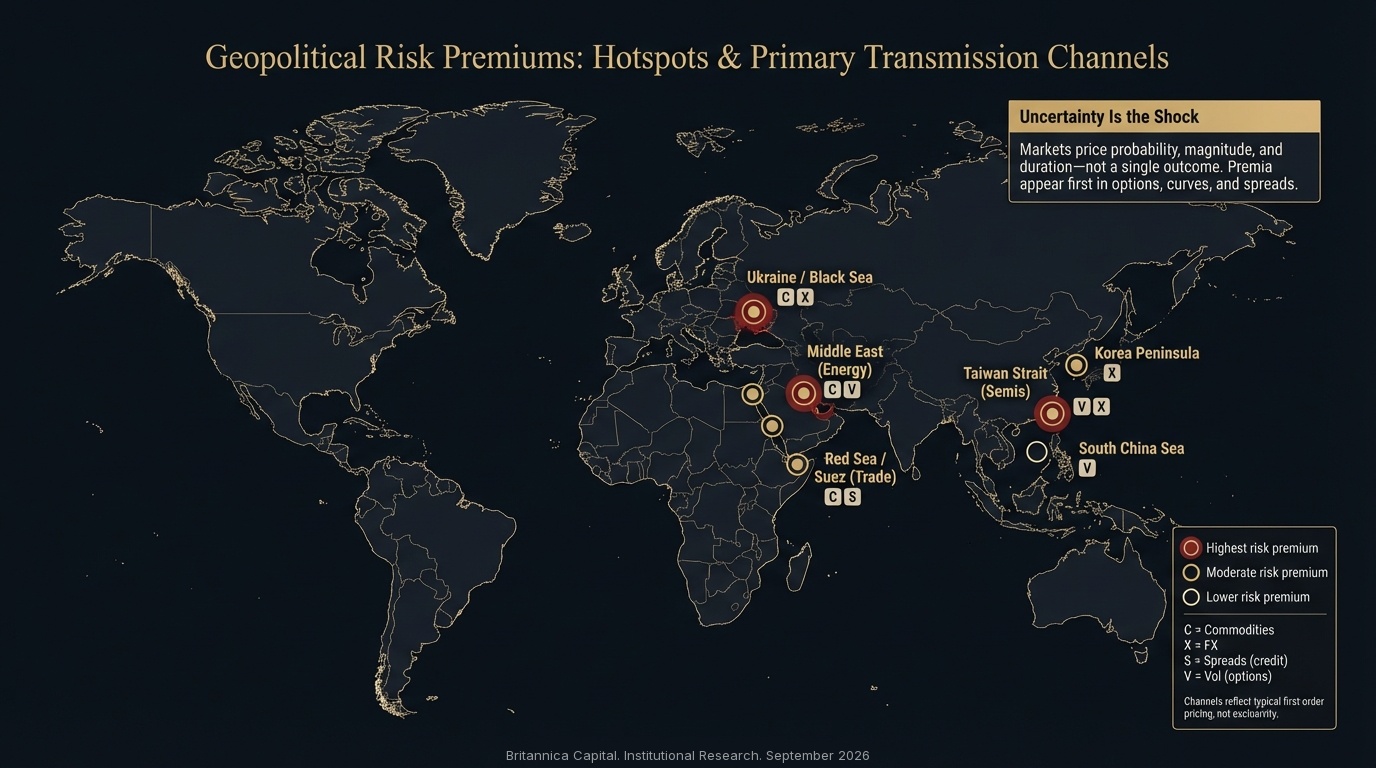
Hotspots & Primary Transmission Channels
Geopolitical risk propagates through four primary channels — energy supply disruption, trade route interdiction, financial sanctions, and technology decoupling. Each channel produces distinct asset class signatures: commodity spikes from supply shocks, credit spread widening from sanctions, and equity sector rotation from technology restrictions.
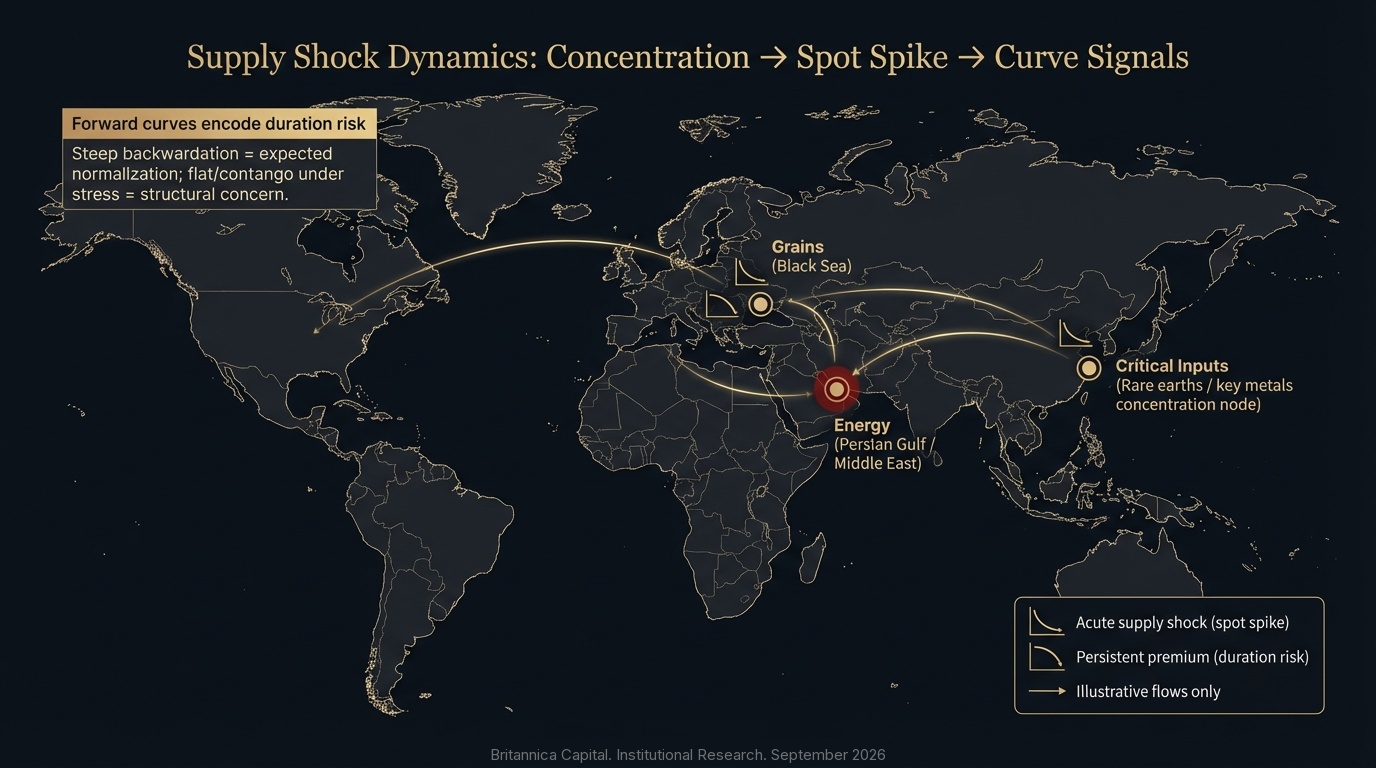
Supply Shock Dynamics
Conflict-driven supply disruptions create asymmetric pricing in energy and agricultural commodity markets. The Ukraine invasion demonstrated how geopolitical shocks can override fundamental supply-demand models, with European natural gas prices surging 400% from pre-conflict levels and global wheat futures repricing the entire forward curve within days. The closure of the Strait of Hormuz that Iran formally announced on 4 March 2026, days after the war began on 28 February, repeated the lesson at larger scale: per World Bank and Reuters reporting, Brent posted its largest monthly gain on record in March 2026 and, per press reports, briefly traded above $126 intraday in late April.
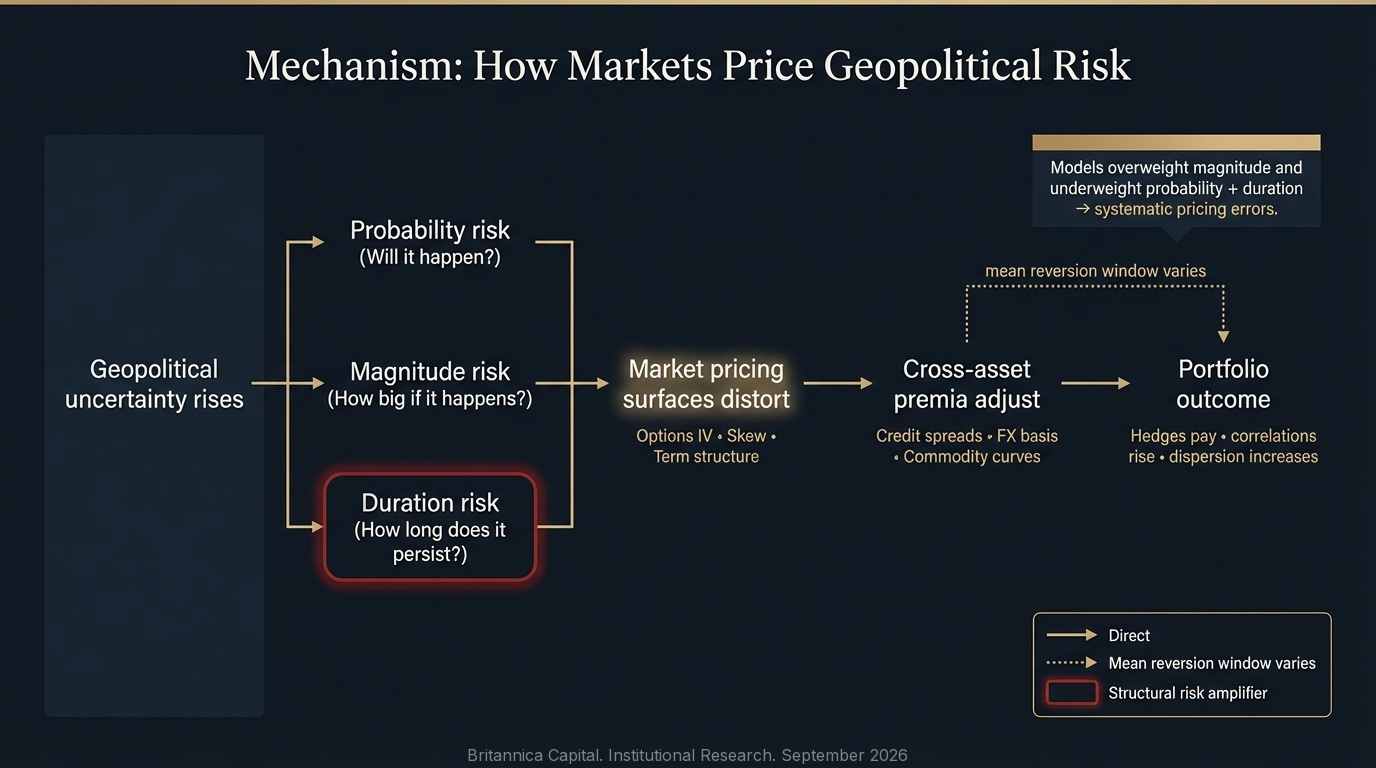
How Markets Price Geopolitical Risk
Options-implied volatility, credit default swap spreads, and commodity forward curves embed forward-looking geopolitical risk assessments that systematically diverge from historical volatility measures. The VIX consistently underprices geopolitical tail risk, while defence sector equity premia and energy options skew provide more reliable real-time signals.
Uncertainty vs Structural Repricing
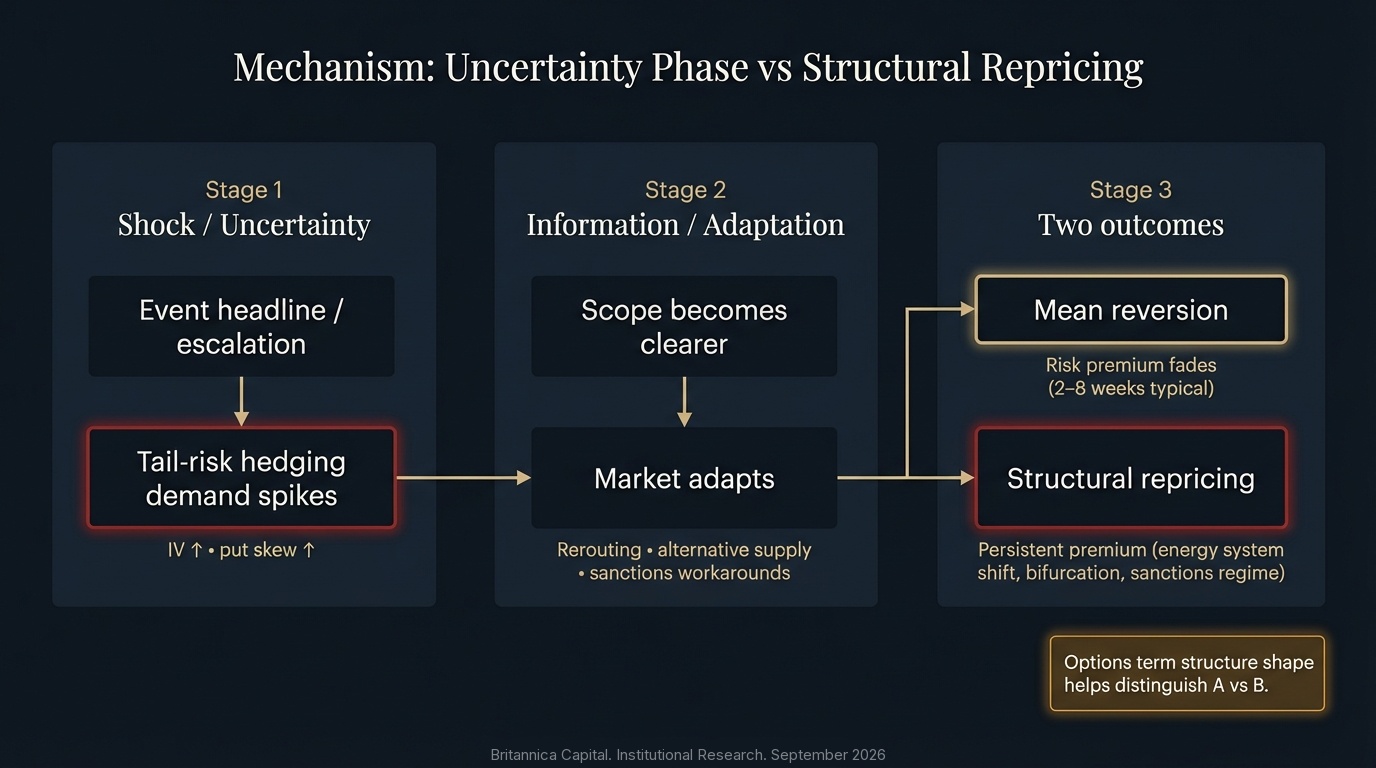
The critical analytical distinction lies between transient uncertainty premiums that mean-revert within weeks and structural repricing events that justify permanent valuation adjustments. Ukraine represented structural repricing for European energy; Taiwan Strait tensions remain in the uncertainty-premium category — but a kinetic escalation would likely trigger a structural repricing on a scale not seen since the 1973 oil shock.
Understanding Market Pricing of Geopolitical Risk
Geopolitical events create measurable impacts on asset prices through multiple transmission channels. Unlike economic shocks where cause-and-effect relationships follow established patterns, geopolitical risk premiums emerge from uncertainty itself rather than from clearly defined outcomes. Markets price the probability distribution of potential scenarios, not specific future states.
This creates analytical challenges that standard risk frameworks struggle to address. Traditional volatility measures often underestimate tail risks from geopolitical events because historical data contains limited information about rare but consequential scenarios. Options markets, credit spreads, and commodity forward curves embed forward-looking information that portfolio managers can systematically exploit.
Recent conflicts demonstrate the heterogeneity of market responses. The Ukraine invasion produced immediate commodity price surges concentrated in energy and agriculture, persistent European equity underperformance, and credit spread widening that varied dramatically by country exposure. The Iran war that began on 28 February 2026, and Iran's formal announcement of the closure of the Strait of Hormuz on 4 March, produced what the World Bank and IEA describe as the largest oil supply shock in history. Per World Bank and Reuters reporting, Brent recorded its largest monthly gain on record in March 2026, and the peak of synchronized market stress came in late March: the S&P 500 drew down roughly 8% to its 30 March low, losing approximately $1 trillion of market value in a single session on 26 March, while the VIX spiked sharply before an April ceasefire, a June memorandum and a July relapse left the strait largely restricted into September. Taiwan Strait tensions generate semiconductor supply chain risk premiums visible primarily in technology sector valuations and Asian currency forwards, though in 2026 those premiums have been masked by AI-driven earnings.
This report provides institutional investors with frameworks to identify, measure, and respond to geopolitical risk premiums across asset classes. We examine pricing mechanisms, present empirical evidence from recent conflicts, and outline implementation strategies that recognize both the opportunities and limitations inherent in trading geopolitical uncertainty.
Geopolitical risk premiums exist when uncertainty about future events exceeds the market's ability to price specific outcomes. This creates temporary mispricings that sophisticated investors can exploit, but also generates tail risk exposures that standard portfolio construction techniques systematically underestimate. The key analytical challenge involves distinguishing between transient risk premiums that mean-revert quickly and structural repricing events that justify permanent valuation adjustments.
Unless otherwise specified, equity returns are price returns in local currency; commodity prices are spot front-month contracts; volatility metrics refer to 30-day implied volatility; and credit spreads are option-adjusted spreads to US Treasuries. Currency basis is USD for international comparisons. Historical volatility calculations use 30-day rolling windows. All data current as of September 1, 2026 unless explicitly dated otherwise.
Risk Premium Framework
A geopolitical risk premium represents the additional return investors demand to hold assets exposed to uncertain political or military events. This premium manifests through multiple channels: higher equity risk premiums for affected sectors and regions, wider credit spreads for sovereigns and corporates with geopolitical exposure, elevated implied volatility in options markets, and dislocations in commodity forward curves.
The framework distinguishes three distinct components. Probability risk reflects uncertainty about whether an event will occur. Magnitude risk captures uncertainty about the event's economic impact conditional on occurrence. Duration risk addresses uncertainty about how long effects will persist. Standard models typically focus on magnitude while underweighting probability and duration uncertainty, creating systematic pricing errors during geopolitical stress.
Geopolitical shocks transmit through direct trade disruption (sanctions, embargoes), supply chain fragmentation (alternative sourcing, inventory buffer increases), policy uncertainty (investment delays, higher discount rates), and flight-to-safety flows (sovereign debt bid, dollar strength, gold demand). Each channel operates on different timescales and affects different asset classes with varying intensity.
How Markets Price Conflicts
Armed conflicts generate immediate volatility spikes followed by gradual normalization as markets adapt to new realities. Initial price movements reflect worst-case scenario positioning, with rapid mean reversion once the scope and intensity of conflict becomes clearer. The critical insight is that markets price tail risk during the uncertainty phase, then reprice toward expected outcomes as information accumulates.
Historical evidence shows distinct patterns. Interstate conflicts between nuclear powers produce severe but brief equity selloffs concentrated in regionally exposed sectors, commodity price spikes in affected markets, and a tendency toward defense sector outperformance that is neither uniform nor guaranteed. Regional conflicts without major power involvement generate more localized impacts with faster normalization. Civil conflicts and insurgencies create country-specific risk premiums with minimal spillover unless they threaten critical infrastructure or commodity supplies.
| Conflict Type | Initial Equity Impact | Commodity Response | Normalization Period | Risk Persistence |
|---|---|---|---|---|
| Great Power Confrontation | −8% to −15% | +15% to +40% | 3-6 months | High |
| Regional Interstate War | −3% to −8% | +8% to +20% | 6-12 weeks | Medium |
| Civil Conflict / Insurgency | −1% to −4% | +2% to +10% | 2-4 weeks | Low |
| Isolated Military Action | −0.5% to −2% | +1% to +5% | 1-2 weeks | Low |
Defense and aerospace equities have often outperformed during conflict escalation periods, with positive excess returns in many acute crisis phases. This reflects both increased government procurement expectations and portfolio rebalancing toward sectors perceived as conflict-resilient. The effect can persist longer than general market volatility, but it is neither uniform nor guaranteed. The 2026 Iran war offered a clear counter-example: European aerospace and defence indices fell during March 2026 as crowded positioning unwound and the conflict highlighted low-cost drone warfare (Reuters, April 2026), a reminder that the effect is strongest when an escalation implies new procurement rather than a repricing of existing programmes. SIPRI's April 2026 data put world military expenditure at $2,887 billion in 2025, up 2.9% in real terms and 2.5% of world GDP, with European spending up 14%.
Sanctions Pricing Mechanisms
Economic sanctions create discrete pricing events followed by gradual economic adjustment. Unlike military conflicts where uncertainty dominates initial pricing, sanctions generate immediate clarity about policy but substantial uncertainty about economic consequences. Markets must price complex feedback loops involving alternative trading relationships, sanctions evasion networks, and secondary enforcement risk.
Primary sanctions (restrictions on direct transactions with sanctioned entities) create immediate price dislocations as affected assets become partially or fully illiquid. Russian equity and debt instruments experienced 70-90% drawdowns in accessible markets following comprehensive sanctions implementation, far exceeding fundamental damage estimates. This reflects liquidity premium compression and forced selling rather than pure economic impact assessment.
Secondary sanctions (penalties for third parties dealing with sanctioned entities) generate risk premiums through compliance uncertainty. Financial institutions demand wider spreads and reduced exposure limits for transactions with any sanctions proximity, creating financing constraints that exceed direct sanctions scope. This amplification mechanism makes comprehensive sanctions regimes more economically damaging than targeted measures.
The sanctions landscape remained active through the summer of 2026. The European Union adopted its 21st package of measures against Russia on 23 July 2026, described in legal commentary (Mayer Brown / Covington) as its largest designation round since February 2022, with transaction bans on 33 Russian banks taking effect on 13 August. In the Middle East, press reports indicate that US sanctions relief granted under the June 2026 Islamabad Memorandum was reversed after the July breakdown of the ceasefire, illustrating how sanctions relief itself has become a negotiating variable whose reversibility markets must price.
Immediate Effects
Medium-term Adaptation
Financial institutions operating in sanctioned-adjacent markets face perpetual uncertainty about enforcement boundaries. This generates persistent risk premiums in affected credit markets even for non-sanctioned entities with any geographic or sectoral proximity. Banks effectively impose internal sanctions buffers that exceed regulatory requirements, amplifying economic impact through risk-averse interpretation of ambiguous restrictions.
Supply Shock Pricing Dynamics
Geopolitical supply shocks in commodity markets generate distinct price patterns that differ fundamentally from demand-driven movements. Supply disruptions create immediate spot price spikes as buyers compete for available inventory, followed by forward curve backwardation that reflects expectations of future supply normalization. The magnitude depends on disruption severity, inventory levels, and substitution possibilities.
Energy markets exhibit the strongest geopolitical sensitivity due to concentrated production geography and limited short-term supply elasticity. A 2-3 million barrel per day disruption in crude oil supply typically generates 15-25% spot price increases within days, with effects persisting until alternative supply sources activate. Natural gas shows even greater volatility due to transportation constraints and regional market segmentation.
Agricultural commodities respond more moderately to geopolitical events unless conflicts directly affect major production regions during critical growing seasons. Metal markets show heterogeneous responses based on concentration of production and strategic importance. Rare earth elements and certain industrial metals face significant geopolitical risk premiums due to China's production dominance and limited alternatives. China's October 2025 rare-earth export controls are suspended until 10 November 2026 under the US–China trade arrangement, but enforcement of the underlying licensing regime has continued, including the June 2026 addition of US rare-earth producers to China's export control list.
The 2026 Strait of Hormuz closure, formally announced by Iran on 4 March 2026, is the most consequential live test of this framework. Roughly 20 million barrels per day of crude and products transited the strait before the war (per World Bank/EIA); daily tanker transits fell to around ten vessels in mid-August against roughly 130 pre-war (Al Jazeera, 12 August 2026), and reportedly to six on 2 September. Per World Bank and Reuters reporting, Brent recorded its largest monthly gain on record in March 2026, in what the World Bank and IEA describe as the largest oil supply shock in history; press reports describe a further brief intraday high in late April, and Brent was trading near $90–96 in late August and early September (Trading Economics). The gas channel proved even more severe: press reports indicate that strikes damaged two LNG trains at Ras Laffan in March, QatarEnergy shipped only 18 LNG cargoes in the six months to late August against 509 a year earlier (Bloomberg, 28 August 2026), and Dutch TTF gas reached about €74/MWh on 2 September, reportedly its highest since January 2023.
| Commodity Category | Supply Concentration | Typical Price Response | Duration | Hedging Difficulty |
|---|---|---|---|---|
| Crude Oil | OPEC ~35% global output | +15% to +30% | 3-9 months | Low |
| Natural Gas | Regional monopolies | +25% to +60% | 6-18 months | High |
| Wheat / Corn | Moderate (top 5 = 60%) | +8% to +20% | 1 crop season | Low |
| Rare Earth Elements | China produces ~68% (USGS, 2026) | +30% to +80% | 2-5 years | High |
| Aluminum / Copper | Moderate concentration | +10% to +25% | 6-12 months | Medium |
Commodity forward curves embed market expectations about supply normalization timing. Steep backwardation signals expectations of near-term tightness with eventual resolution, while persistent contango suggests structural supply concerns. Changes in curve shape provide tradeable signals about evolving market perceptions of geopolitical risk duration and severity.
Measuring Risk Premiums
Quantifying geopolitical risk premiums requires isolating price movements attributable to political uncertainty from those driven by fundamental economic factors. Standard event study methodologies provide baseline estimates but often fail during periods of multiple concurrent shocks. More sophisticated approaches combine textual analysis of news flow, options-implied probability distributions, and term structure decomposition.
Implied volatility surfaces contain valuable information about market-perceived tail risks. Out-of-the-money put options on affected equity indices and currencies embed probability assessments of adverse scenarios. The volatility risk premium (difference between implied and realized volatility) widens during geopolitical stress, creating opportunities for variance selling strategies in less-affected markets and protective buying in exposed assets.
Credit markets offer complementary signals through spread decomposition. Isolating the geopolitical component of credit spreads involves comparing similarly rated entities with differential geopolitical exposure. Pairs trading strategies that exploit relative spread movements between exposed and unexposed credits can generate consistent returns during periods of elevated geopolitical uncertainty.
Implied volatility skew (difference between OTM put and call implied vols) quantifies tail risk pricing. During geopolitical stress, skew steepens as investors bid up downside protection, creating measurable risk premiums. Systematic skew monitoring across equity indices, currencies, and commodity markets provides early warning signals of building geopolitical concerns.
Natural language processing of news flow and government communications generates quantitative geopolitical risk indices. Research shows these text-based measures predict equity volatility and credit spread movements 2-4 weeks forward, offering tactical positioning opportunities before market pricing fully adjusts. The Caldara–Iacoviello Geopolitical Risk Index was already elevated before February 2026 on tariff uncertainty and three concurrent conflicts, and press reports indicate it rose sharply after the outbreak of the Iran war on 28 February 2026.
Ukraine Conflict Market Response
The February 2022 Russian invasion of Ukraine provides a comprehensive case study in geopolitical risk premium evolution. Initial market responses reflected worst-case escalation fears, with the STOXX Europe 600 falling approximately 7% in the week ending 4 March 2022 (its worst weekly performance since March 2020, per Reuters) and Brent crude spiking above $130 per barrel. Subsequent price action demonstrated how markets adapted as the conflict's scope became clearer and its duration extended.
Energy market dislocations dominated economic impacts. European natural gas prices increased 400% from pre-conflict levels, forcing industrial production cuts and accelerating energy transition investments. Russian crude oil redirected to Asian markets at discounts of $20-30 per barrel, fragmenting global oil markets along geopolitical lines. Agricultural commodity prices surged due to Black Sea export disruptions, with wheat reaching decade highs before moderating as alternative supplies activated.
Financial market impacts evolved distinctly across asset classes. In local currency terms, the STOXX Europe 600 declined 13.0% in 2022 versus the S&P 500's 18.1% decline, showing relative European resilience. However, for USD-based investors, euro weakness (EUR/USD fell ~6% in 2022) effectively eliminated this differential, with both regions delivering similar dollar-denominated losses. Underperformance was concentrated in energy-intensive industrials and financial institutions with Eastern European exposure. Credit spreads widened most severely for entities with Russian supply chain dependencies or significant regional revenue. Defense sector equities generated 25-40% returns as NATO defense spending commitments increased.
Diplomatic progress stalled in 2026. According to press reports (The Moscow Times / NV, August 2026), trilateral US–Russia–Ukraine talks have been suspended since February 2026, when negotiators last met in Geneva and attention shifted to the Iran war. Short truces for Orthodox Easter (11–12 April) and 9–11 May were marred by mutual violation claims, and in July the Kremlin said there was no immediate prospect of resuming formal negotiations. On 14 August Russia's foreign minister rejected any ceasefire that freezes the current front line, while on 27 August Ukraine's presidential office indicated trilateral talks could resume as early as September. Markets have largely stopped pricing a near-term settlement: the STOXX Europe 600 closed at a record 660 on 8 August 2026 (per Reuters) despite the war entering its fifth year.
| Market Segment | Peak Impact (2022) | 1-Year Response | Current Status (Sep 2026) | Key Driver |
|---|---|---|---|---|
| Brent Crude | +65% ($80 → $130) | +40% sustained | $90-96 (Aug 28 – Sep 3, 2026) | Hormuz closure (2026) |
| European Gas (TTF) | +400% spike | +200% sustained | ~€62-75/MWh (Aug 17 – Sep 3, 2026) | Supply shift; Gulf LNG outage |
| Wheat Futures | +50% spike | +25% sustained | Normalized | Alternative exports |
| STOXX Europe 600 | −7% week to 4 Mar | −13.0% full year 2022 | Record 660 (Aug 8, 2026, per Reuters) | Energy cost structure |
| Defense Equities | +25% outperform | +40% cumulative | Substantially re-rated since 2022; drew down in Mar 2026 unwind (Reuters) | Defense spending |
Four and a half years into the conflict, several structural changes remain evident. Europe's post-2022 dependence on seaborne LNG has left it exposed to a different chokepoint: the 2026 Gulf disruption pushed TTF back above €70/MWh (Trading Economics), roughly double its pre-war February 2026 level, without any change in Russian flows. Regional equity valuations incorporated higher perceived geopolitical risk during 2022-2023, though many effects have since moderated. The critical insight is that markets initially priced for transient disruption but subsequently repriced for permanent structural changes in energy markets and security architecture, with some of those premiums persisting while others have mean-reverted as Europe adapted.
Taiwan Strait Risk Premium
Taiwan Strait tensions create persistent but fluctuating risk premiums concentrated in semiconductor supply chains and Asian financial markets. Unlike the Ukraine conflict which manifested as discrete escalation followed by protracted warfare, Taiwan risk operates as recurring tension cycles that generate intermittent volatility spikes without resolution. This creates distinct pricing dynamics dominated by options markets and semiconductor industry valuations.
Semiconductor concentration represents the central economic vulnerability. Taiwan accounts for over 90% of the world's leading-edge chip manufacturing capacity (U.S. International Trade Administration), with TSMC alone producing the vast majority of advanced logic semiconductors at sub-7nm process nodes. This creates irreplaceable supply bottlenecks for global technology industries. Any sustained disruption would force immediate production shutdowns across automotive, consumer electronics, and data center sectors with third-party estimates placing cumulative economic impacts above $1 trillion annually.
Market pricing of Taiwan risk appears in multiple forms. Asian equity indices show elevated volatility clustering around tension escalations, with Taiwan-weighted indices underperforming regional peers by 3-8% during acute periods. Technology sector valuations embed persistent discounts for companies with concentrated Taiwan fab exposure. Options markets show structural put skew in semiconductor equities exceeding levels justified by historical volatility, suggesting meaningful tail risk concerns.
The 2026 pattern has been rising military pressure alongside record valuations. Per reporting from the Global Taiwan Institute and the Washington Post, the PLA's "Justice Mission-2025" exercise on 29–30 December 2025 deployed roughly 130 aircraft and 28 ships in a rehearsed blockade with declared operating areas closer to Taiwan's contiguous zone than in prior drills, and Taiwan's annual Han Kuang exercise (5–14 August 2026) was expanded to counter grey-zone scenarios. Yet press reports indicate the TAIEX set successive records through mid-2026, and the largest Taiwanese foundry reported July 2026 revenue up sharply year on year on AI demand. The analysis reads this as an uncertainty premium being overwhelmed by an earnings cycle, not as a premium that has been resolved: the tail-risk component remains visible in options skew even as spot valuations ignore it.
Direct Exposures
Secondary Effects
Persistent elevated implied volatility in Taiwan and semiconductor equity options indicates markets price meaningful probability of severe disruption despite low base rates. This elevated volatility premium relative to realized volatility creates opportunities for sophisticated volatility arbitrage strategies, though tail risk management remains essential given the magnitude of potential supply chain disruption.
Options Market Intelligence
Options markets provide the most precise measurement of geopolitical risk premiums through their forward-looking probability assessments. Unlike historical volatility which reflects past outcomes, implied volatility surfaces embed market participants' collective expectations about future uncertainty. During geopolitical stress, these surfaces distort in predictable patterns that reveal both market psychology and potential trading opportunities.
Volatility skew steepens dramatically when geopolitical risks escalate. Out-of-the-money put options command substantial premiums relative to calls, reflecting asymmetric downside concerns. A 25-delta put-call skew exceeding 5 volatility points indicates elevated tail risk pricing. This metric provides quantitative confirmation of geopolitical stress and helps time entry into protective strategies or contrarian positions depending on conviction about actual versus perceived risks.
Term structure of implied volatility offers additional insights. Geopolitical events typically elevate near-term implied volatility more than longer-dated options, creating inverted volatility term structures. This inversion signals expectations of acute uncertainty resolving over time. Conversely, flat or upward-sloping term structures during geopolitical stress suggest markets price persistent rather than transient disruption.
The 2026 Iran war provided a clean test of these metrics. Press reports indicate the VIX spiked sharply from the mid-teens in the opening weeks after the war began on 28 February, and the peak of synchronized cross-asset stress came in late March, when, per World Bank and Reuters reporting, Brent posted its largest monthly gain on record and the S&P 500 lost roughly $1 trillion of market value in a single session on 26 March. Volatility then receded once the scope of the conflict became clearer: the S&P 500 recovered its roughly 8% drawdown (per Reuters reporting) and, per press reports, set a new record in mid-April after the ceasefire announcement. By mid-August the VIX had fallen to a 2026 low near 14 (CNBC, 17 August 2026) even though the Strait of Hormuz remained largely restricted following Iran's 4 March closure announcement, an example of equity volatility markets pricing the resolution of uncertainty rather than the persistence of the underlying disruption, which migrated instead to oil, gas and bond markets.
| Options Metric | Normal Environment | Geopolitical Stress | Interpretation |
|---|---|---|---|
| VIX Index | 12-18 | 22-35+ | Broad equity market uncertainty |
| 25Δ Put-Call Skew | 2-4 vol points | 6-12 vol points | Tail risk premium intensity |
| Vol Term Structure | Upward sloping | Inverted or flat | Expected crisis duration |
| Risk Reversal | −1% to −2% | −4% to −8% | Directional bias strength |
| Vol Risk Premium | 3-5 vol points | 8-15 vol points | Hedging demand pressure |
Elevated geopolitical risk premiums in options create both hedging opportunities and potential overpricing to exploit. Systematically selling volatility in less-affected markets while maintaining protection in directly exposed assets can generate consistent returns during prolonged geopolitical uncertainty. However, tail risk management remains essential as implied volatility occasionally underprices actual event severity despite appearing elevated relative to historical norms. Implementation depends on investor mandate, liquidity constraints, and risk tolerance.
Portfolio Construction Implications
Geopolitical risk premiums create both hazards and opportunities for institutional portfolios. Traditional mean-variance optimization frameworks systematically underestimate tail risks from geopolitical events because historical return distributions contain insufficient information about rare but consequential scenarios. This necessitates explicit consideration of geopolitical exposures in portfolio construction rather than treating them as undifferentiated components of overall market risk.
Geographic diversification provides incomplete protection during systemic geopolitical crises. Correlations across regional equity markets increase substantially during conflict periods, reducing diversification benefits precisely when needed most. However, systematic exposure to defensive sectors, commodity producers, and currency havens generates meaningful downside protection. The optimal approach involves combining broad diversification with tactical overlays that adjust exposure based on evolving geopolitical risk assessments.
Fixed income allocations require particular attention to sovereign credit risk and sanctions exposure. Government bonds from countries with geopolitical tensions trade at meaningful yield premiums that compensate for discrete default risk scenarios. These premiums can offer attractive carry opportunities for investors with appropriate risk tolerance and hedging capabilities, but require continuous monitoring as geopolitical situations evolve.
Supply Chain Mapping
Systematic identification of portfolio companies with concentrated exposure to geopolitically sensitive regions or suppliers. Energy, semiconductors, and rare earth dependencies require explicit monitoring and potential hedging. Secondary exposure through supplier networks often exceeds direct revenue exposure.
Sanctions Proximity Screening
Credit portfolio holdings require ongoing assessment of counterparty connections to sanctioned entities or regions. Secondary sanctions risk creates unexpected credit deterioration for seemingly unrelated issuers. Enhanced due diligence processes should explicitly evaluate geopolitical exposure channels.
Currency Hedge Ratios
Foreign currency exposures in geopolitically sensitive regions warrant dynamic hedging strategies that increase protection during tension escalations. Options-based hedges allow participation in favorable currency movements while limiting downside from crisis-driven depreciations.
Portfolios benefit from maintaining strategic allocations to assets that have tended to appreciate during geopolitical stress. Gold, the Swiss franc, US Treasuries, and defense sector equities have often generated positive returns during conflict periods, providing partial hedges against geopolitical tail risks. The 2026 Iran war was a reminder that this is conditional on the type of shock: because the disruption was inflationary, Treasuries sold off rather than rallied (the 10-year yield reached roughly 4.8% in August 2026, per FRED), the dollar rather than the franc absorbed haven flows, and defence equities fell in March. Gold was the most consistent hedge, though it too retreated from its early-2026 record highs to around $4,435/oz at end of August 2026 (August 31). These positions typically underperform during calm periods but justify their allocation through crisis performance and correlation benefits.
Implementation Framework
Translating geopolitical risk analysis into actionable portfolio decisions requires systematic processes that balance responsiveness with discipline. Reactive trading around every geopolitical headline generates transaction costs and whipsaw losses. Conversely, ignoring geopolitical developments until they generate severe market dislocations misses opportunities to adjust positions when risk premiums are attractive rather than forced.
A tiered monitoring system provides appropriate escalation protocols. Routine geopolitical developments receive attention through regular portfolio reviews without triggering immediate action. Elevated situations with measurable market impacts justify tactical position adjustments within existing risk limits. Critical scenarios threatening portfolio integrity require immediate risk reduction and potential structural portfolio changes.
Monitoring Protocol
Response Framework
Implementation timing significantly affects outcomes. Markets typically overreact to initial geopolitical shocks before mean-reverting as uncertainty resolves. This creates opportunities for patient capital to enter positions after initial volatility spikes, capturing risk premiums without suffering through maximum drawdowns. However, distinguishing transient overreaction from genuine structural repricing requires continuous reassessment as events unfold.
Strategic Takeaways for Institutional Allocators
"Geopolitical risk premiums exist not because markets fail to incorporate available information, but because the information itself is fundamentally uncertain until events resolve."Britannica Capital Research — September 2026
Geopolitical risk premiums create persistent challenges and opportunities for institutional portfolios. Standard financial models systematically underestimate tail risks from political and military events because historical data provides limited guidance about rare but consequential scenarios. This necessitates explicit incorporation of geopolitical analysis into investment processes rather than treating political risk as an undifferentiated component of market volatility.
The appropriate analytical stance combines systematic monitoring with disciplined opportunism. Reactive trading around every geopolitical development generates costs without benefits. Ignoring geopolitical risk until crises force action ensures buying protection at maximum cost. The optimal approach involves continuous assessment of evolving risks, pre-positioning for known vulnerabilities, and tactical adjustments when risk premiums diverge substantially from assessed probabilities.
Options markets, credit spreads, and commodity forward curves embed forward-looking information that portfolio managers should systematically exploit. Persistent elevation of implied volatility, steepening of volatility skew, and widening of geopolitical credit spreads all signal opportunities to either hedge exposure or take contrarian positions depending on conviction about actual versus perceived risks.
Supply Chain Concentration Risk
Geographic concentration in critical supply chains (semiconductors in Taiwan, rare earths in China, energy in unstable regions) creates tail risks that traditional portfolio optimization ignores. Explicit mapping and hedging of these exposures has become essential rather than optional.
Options as Information Source
Derivatives markets provide superior forward-looking risk assessments compared to historical volatility measures. Systematic monitoring of implied volatility surfaces, skew metrics, and term structures offers early warning signals and timing guidance for tactical adjustments.
Correlation Breakdown Awareness
Geographic diversification provides less protection during geopolitical crises than normal periods. Portfolio construction should explicitly account for increased correlations during stress and maintain strategic allocations to genuine hedges like gold, haven currencies, and defensive sectors, recognising that the 2026 oil shock showed sovereign bonds do not hedge an inflationary geopolitical event.
The highest-return implementation priorities involve systematic screening for concentrated geopolitical exposures, development of quantitative monitoring frameworks, and pre-established response protocols that enable disciplined rather than panic-driven decision making during crisis periods. These processes generate value through both crisis avoidance and opportunistic positioning during periods of elevated but mispriced risk premiums.
The framework identifies five scheduled or live catalysts for the remainder of 2026. Strait of Hormuz: the July breakdown of the ceasefire, press reports of renewed strikes in early September and QatarEnergy's force majeure extensions into the fourth quarter (Bloomberg, 28 August 2026) keep the energy channel open; oil, gas and Gulf-linked shipping rather than equity volatility remain the primary pricing venue. Monetary response: the FOMC meets on 15–16 September with markets split on whether the oil-driven inflation impulse forces a hike from the 3.50–3.75% range. US–China deadlines: the US suspension of heightened reciprocal tariffs on China and China's suspension of its October 2025 rare-earth export controls both run to 10 November 2026, and a formal extension had not been agreed as of end-August. Trade litigation: the Section 301 duties that replaced the Section 122 surcharge on 24 July (per legal commentary) reportedly face a multi-state challenge filed in early August. Ukraine: per press reports, a possible resumption of trilateral talks in September, against Moscow's stated rejection of a front-line freeze. None of these is priced as a resolved outcome; each is a probability-and-duration question of the kind this framework is designed to monitor.