Academic research and institutional practice typically classify inflation regimes along two primary dimensions: absolute level and directional trend. Our framework distinguishes between four primary regime states, each exhibiting distinct asset class behaviour patterns.
Macro
Economic
Inflation Regimes & Market Outcomes
A Comprehensive Analysis of Asset Class Performance Across Inflationary Environments
A Comprehensive Analysis of Asset Class Performance Across Inflationary Environments
A regime-based framework for understanding how the direction, persistence, and volatility of inflation reshape cross-asset correlations, duration risk, and optimal portfolio construction for institutional allocators.
Regime Classification
Four Regimes That Define Returns
Inflation environments are classified into four distinct regimes — low & stable, rising, high & volatile, and falling — each producing fundamentally different cross-asset correlation structures. The direction and persistence of inflation trends matter more for portfolio outcomes than absolute price levels.
Equity Dynamics
Non-Linear Equity Sensitivity
Equities exhibit a non-linear relationship with inflation: moderate levels support earnings growth and multiples, while persistent above-target inflation compresses valuations through rising discount rates. Sector dispersion widens dramatically during regime transitions, favouring pricing-power leaders.
Fixed Income
Duration Risk Repriced
Bond markets face structural headwinds in rising and volatile inflation regimes as term premiums expand and real yields swing. The traditional 60/40 diversification benefit breaks down when inflation exceeds 4%, demanding flexible duration mandates and a pivot toward inflation-linked and corporate credit exposures.
Portfolio Construction
Real Assets as Regime Hedges
Gold, commodities, and real estate deliver their strongest risk-adjusted returns precisely when traditional portfolios struggle most — during high and rising inflation. Allocating 15–20% to real assets provides meaningful regime diversification that cannot be replicated through nominal bond exposure alone.
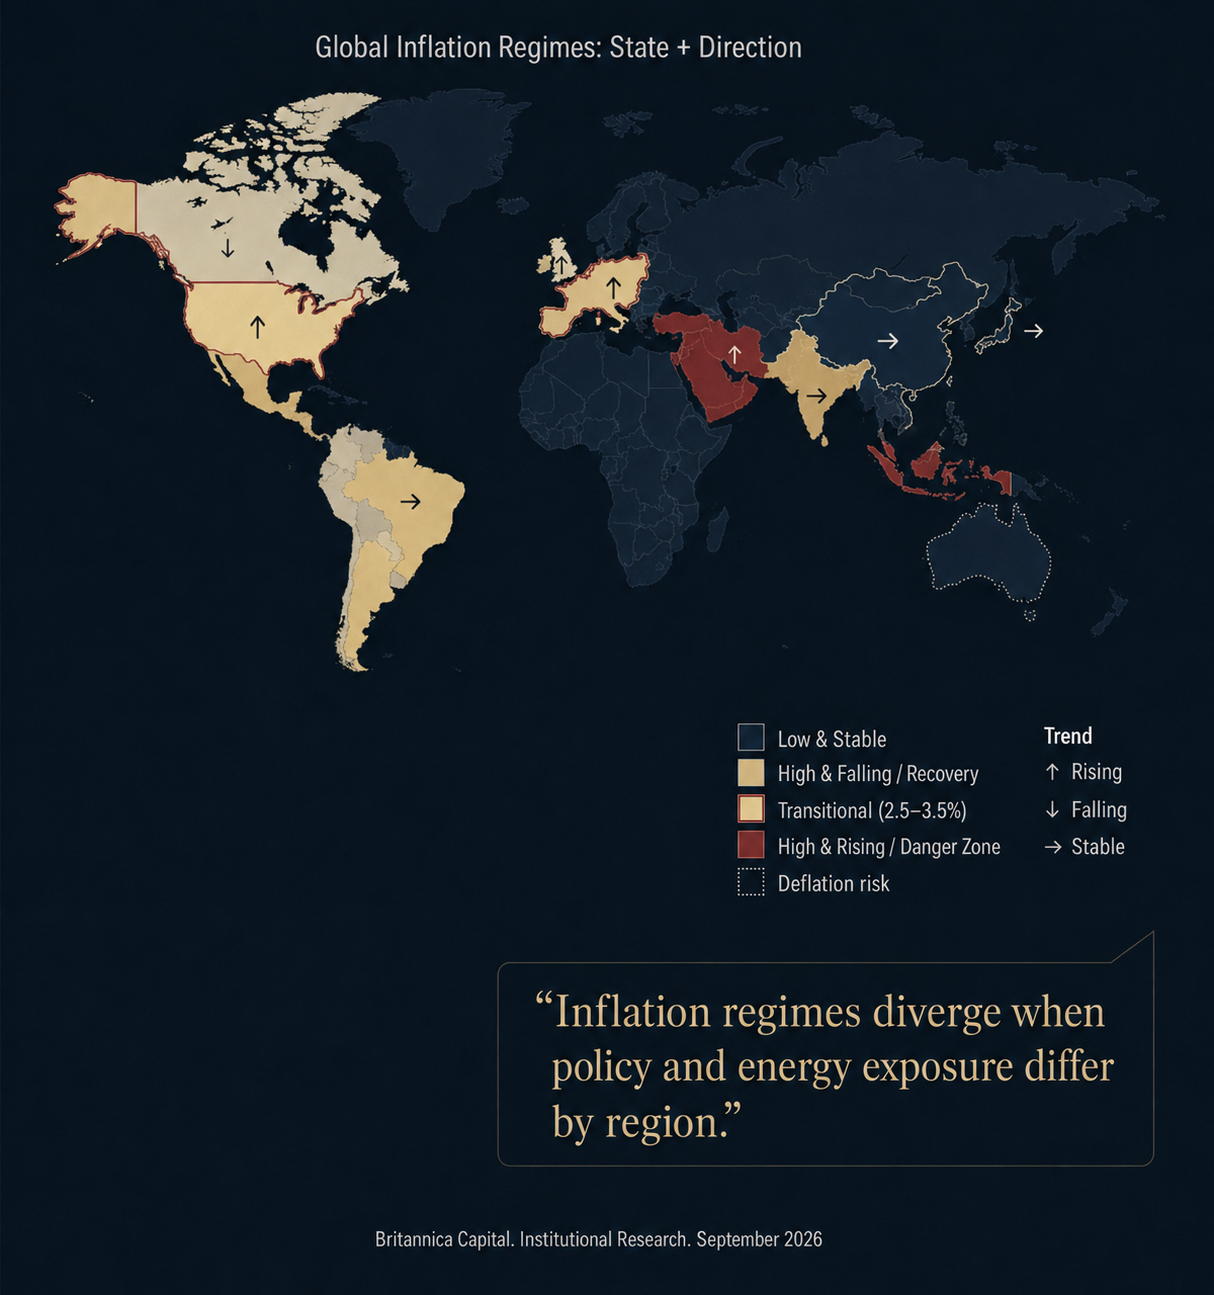
Global Inflation Regimes
Britannica Capital · Institutional Research
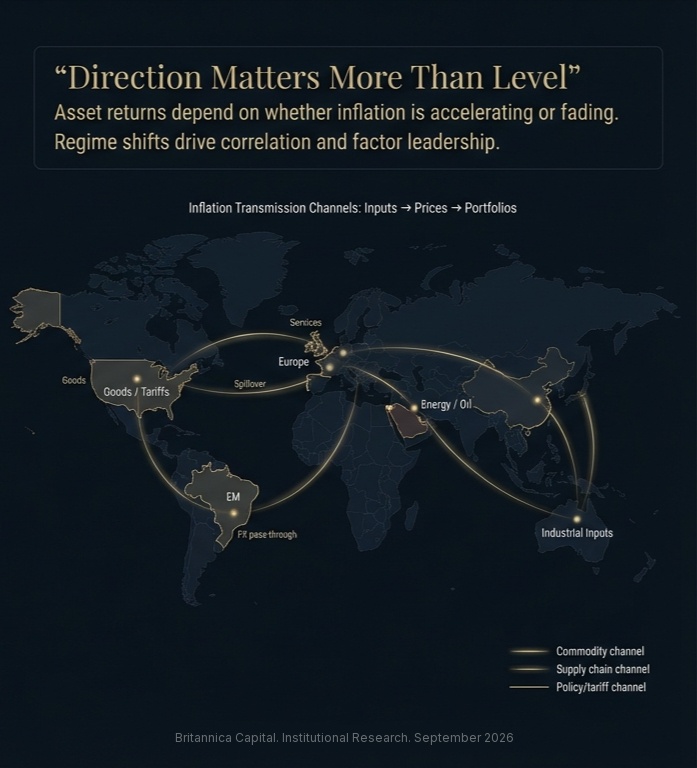
Inflation Transmission Channels
Britannica Capital · Institutional Research
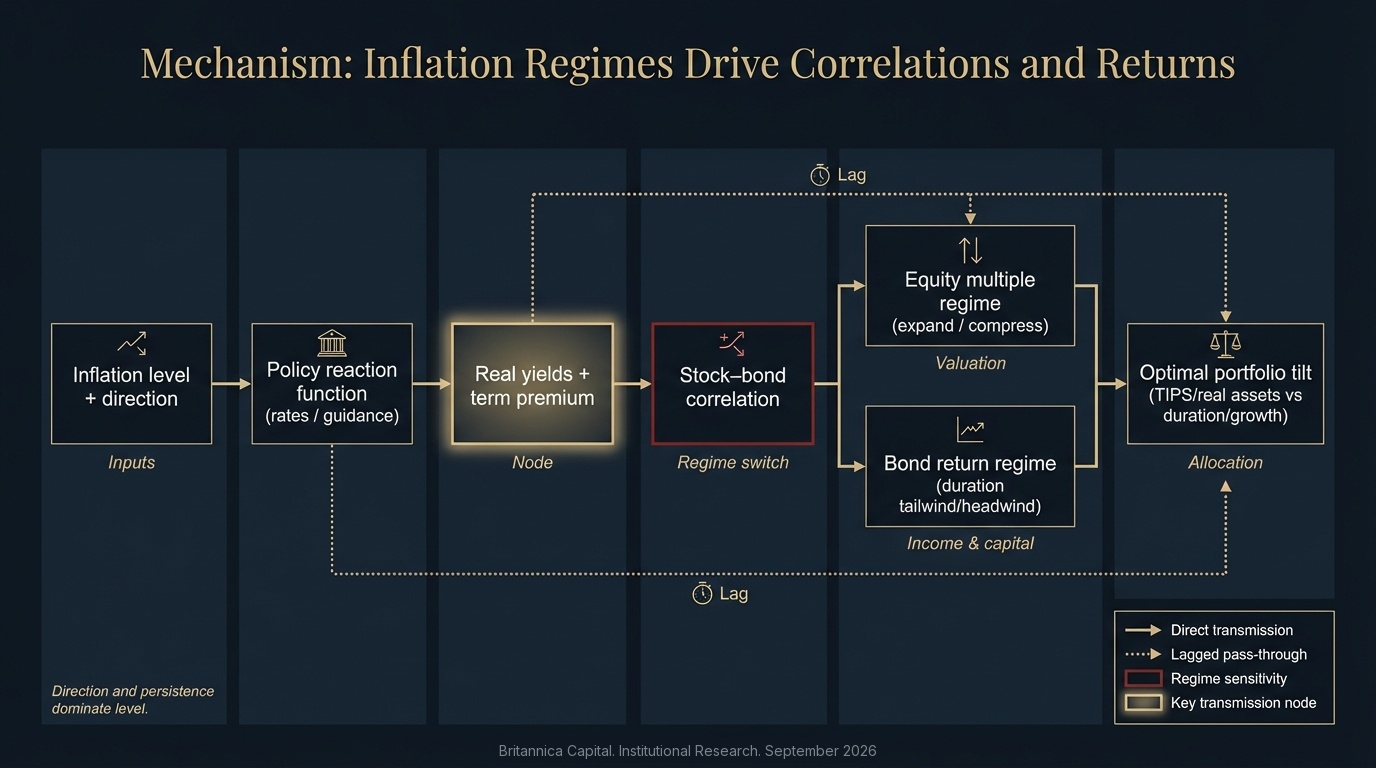
Inflation Regimes Drive Correlations and Returns
Britannica Capital · Institutional Research
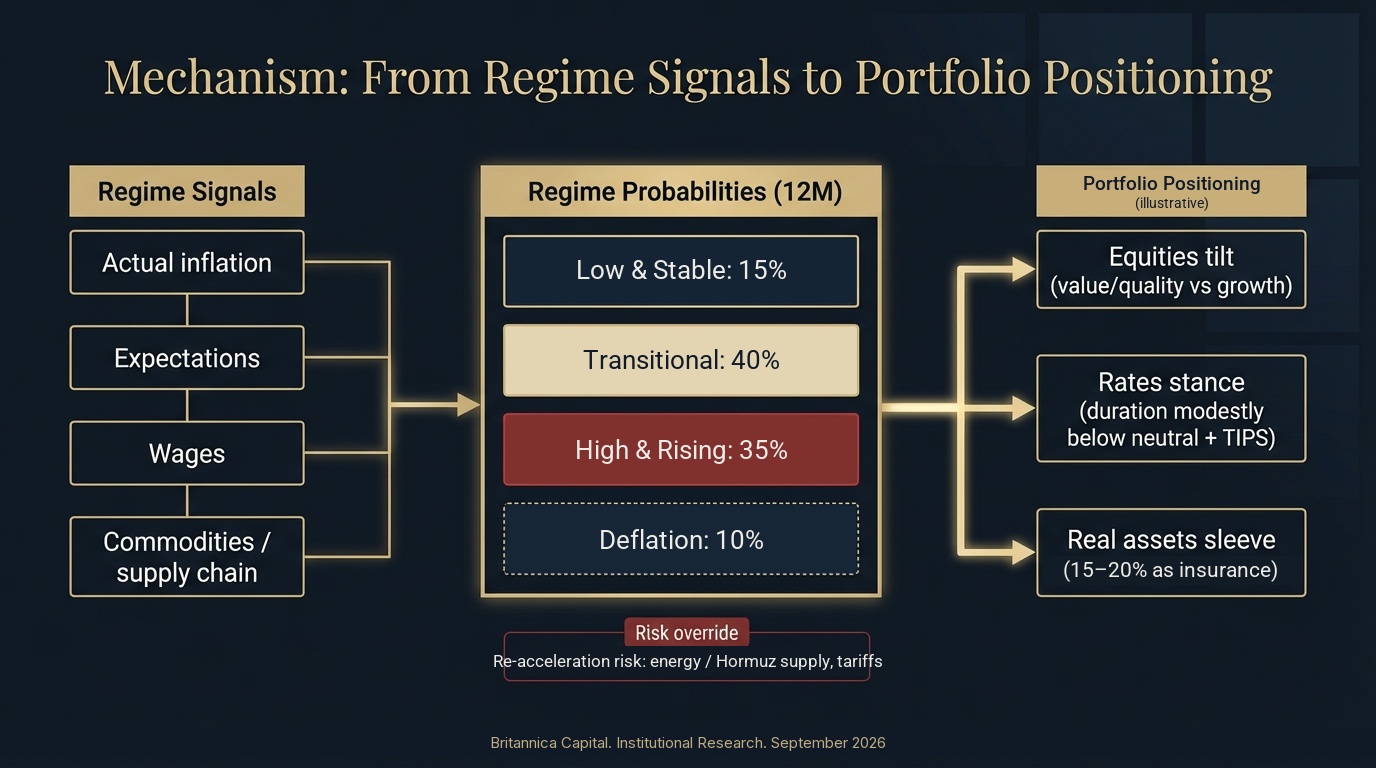
From Regime Signals to Portfolio Positioning
Britannica Capital · Institutional Research
Coming Soon
Video Content in Production
Video briefings and analyst commentary for this report are currently being produced. Check back for updates.
Executive Summary
The disinflation that defined 2023–25 was interrupted in 2026 by what the World Bank and IEA describe as the largest oil supply shock in history, and understanding how different inflation regimes impact asset class performance has become paramount for institutional investors. Our analysis reveals that the direction and persistence of inflation trends matter more for portfolio construction than absolute inflation levels.
Current data show U.S. core PCE inflation at 3.3% year-on-year in July 2026, with headline PCE at 3.7% (BEA); on the CPI measure, headline inflation was 3.4% and core 2.5% (BLS). The re-acceleration followed the Middle East conflict that began on 28 February 2026 and Iran's formal announcement on 4 March of the closure of the Strait of Hormuz, which pushed energy prices sharply higher from March. The IMF's July 2026 update projects global headline inflation rising from 4.1% in 2025 to 4.7% in 2026 before easing to 3.9% in 2027, while China remains close to zero inflation. This environment presents unique challenges requiring nuanced portfolio positioning across multiple inflation scenarios.
3.3%
U.S. Core PCE
July 2026, y/y (BEA)
4.7%
Global Headline Inflation
2026 projection (IMF, July 2026)
2.9%
U.K. Headline CPI
July 2026, y/y (ONS); August released Sept 16
3.3%
Euro Area HICP
August 2026 flash (Eurostat)
01
Classification
Understanding
Inflation Regimes
Goldilocks
Low & Stable
Below 3%, minimal volatility. Traditional 60/40 performs well; negative stock-bond correlation provides diversification. Optimal: equities (growth), nominal bonds, duration strategies.
Danger Zone
High & Rising
Above 3% and accelerating. Stock-bond correlation turns positive; traditional portfolios struggle. Optimal: commodities, energy equities, real estate, TIPS, floating rate.
Recovery
High & Falling
Disinflation from elevated levels. Strong bond performance; equity multiples expand as rates peak. Optimal: nominal bonds (duration), quality equities, selective value.
Defensive
Deflation / Very Low
Below 1% or negative. Flight to safety; nominal assets preferred over real assets. Optimal: government bonds, cash, quality dividend equities, gold.
The current environment is best described as a transitional regime with rising headline pressure in developed markets. U.S. core PCE had declined from its 5.6% peak (February 2022) to 2.7% in early 2026, but the Middle East conflict that began on 28 February 2026 and the closure of the Strait of Hormuz, formally announced by Iran on 4 March 2026, pushed Brent crude above $120 per barrel in March, with market stress peaking in late March; by July 2026 U.S. core PCE had risen to 3.3% and headline PCE to 3.7% (BEA), headline CPI stood at 3.4% and core CPI at 2.5% (BLS), and energy prices were up 14.7% year-on-year in the CPI. Tariff policy adds a second, smaller upside channel in the U.S., euro area HICP has re-accelerated to 3.3% year-on-year on energy (August 2026 flash estimate, Eurostat), and China's near-zero inflation (CPI +0.5% year-on-year, July 2026, NBS; August released ~Sept 9) remains the principal disinflationary counterweight. The IMF's April 2026 outlook raised its 2026 inflation projection for emerging market and developing economies to 5.5%, and several emerging market central banks have paused easing cycles in response.
02
Historical Analysis
Equity Market
Dynamics
The relationship between equity performance and inflation proves highly non-linear and regime-dependent. Historical analysis from 1973–2025 demonstrates that equities perform best in low inflation environments, with progressively deteriorating real returns as inflation rises. P/E ratios decline approximately 37% when inflation moves from 2% to 6%, all else equal.
| Inflation Regime | Avg. Real Return | Beat Inflation % | Volatility | Best Sectors |
|---|---|---|---|---|
| Low & Rising (< 3%) | +8.2% | 90% | 14.5% | Technology, Consumer Discretionary, Financials |
| High & Rising (> 3%) | +1.4% | 52% | 22.3% | Energy, Materials, Utilities |
| High & Falling | +6.7% | 75% | 16.8% | Financials, Industrials, Consumer Staples |
| Deflation / Very Low | +5.1% | n/a | 18.9% | Healthcare, Utilities, Consumer Staples |
Source: Schroders, MSCI USA Index data, BLS inflation data. Real returns calculated net of CPI, 1973–2025.
Sector-Level Analysis: Energy equities exhibit the strongest positive correlation with inflation—delivering 12.9% real returns annually during high inflation and beating inflation 74% of the time. Technology stocks, by contrast, delivered -2.4% real returns during high inflation periods due to long-duration characteristics and margin pressure. The 2026 supply shock has reproduced this pattern: through the end of August 2026 the S&P 500 energy sector led all sectors with a gain of roughly 42% year-to-date, materials and industrials followed, while communication services and consumer discretionary posted negative returns.
Value vs. Growth: Historical data spanning 1927–2020 shows value stocks consistently outperform growth during high inflation, with the magnitude increasing alongside inflation levels. During the highest inflation years, value outperformed growth by an average of 6.8% annually.
Sector Inflation Sensitivity
Energy
9.2 / 10
Materials
7.8 / 10
Real Estate (REITs)
6.9 / 10
Financials
5.4 / 10
Consumer Staples
4.2 / 10
Technology
2.8 / 10
Consumer Discretionary
2.3 / 10
03
Bond Markets
Fixed Income
Performance
Bond market performance across inflation regimes presents perhaps the clearest regime dependency of any asset class. Nominal bonds face direct headwinds from unexpected inflation, which erodes real returns and triggers yield increases that generate mark-to-market losses. TIPS provide explicit protection through principal adjustment mechanisms.
| Fixed Income Type | Low Inflation | High & Rising | High & Falling | Deflation |
|---|---|---|---|---|
| Nominal Treasury Bonds | +4.2% | -6.8% | +12.4% | +8.9% |
| TIPS (Inflation-Linked) | +3.1% | +5.7% | +4.2% | +1.4% |
| Investment Grade Credit | +5.1% | -3.2% | +8.6% | +6.2% |
| High Yield Bonds | +6.8% | +1.9% | +9.2% | -2.1% |
| Floating Rate Loans | +3.9% | +4.8% | +3.2% | +2.6% |
| Emerging Market Debt | +7.2% | -1.4% | +11.3% | +3.8% |
Source: T. Rowe Price analysis, based on Bloomberg/Federal Reserve data, using proxy series for pre-1997 TIPS and early floating-rate periods. Average annual real returns by regime, 1990–2025; reproduced with attribution and not a Britannica Capital calculation.
Floating rate instruments offer partial inflation protection by resetting coupons based on prevailing short-term rates. These securities performed particularly well during the 2022–2024 tightening cycle, generating positive returns while fixed-rate bonds suffered substantial losses.
The 2026 episode has reinforced the regime dependency. With headline PCE at 3.7%, the 10-year Treasury yield rose to approximately 4.7–4.8% by late August 2026 (FRED, DGS10), while the 10-year breakeven inflation rate held near 2.3% (FRED, T10YIE). The move was therefore concentrated in real yields and term premium rather than in long-run inflation expectations — NY Fed ACM estimates suggest the 10-year term premium was positive and elevated in August 2026 — a configuration in which nominal duration and equities have tended to fall together and the stock–bond diversification benefit weakens.
04
Inflation Hedges
Real Assets &
Alternatives
Real assets—including commodities, real estate, infrastructure, and natural resources—represent the most direct inflation hedges available to institutional investors. These assets demonstrate positive correlation with unexpected inflation and provide portfolio diversification benefits during stress periods when stock-bond correlations turn positive.
| Asset Class | High Inflation Return | Low Inflation Return | Outperformance |
|---|---|---|---|
| Commodities | +14.2% | +3.1% | +11.1% |
| Real Estate (Direct) | +8.7% | +6.4% | +2.3% |
| Infrastructure | +9.3% | +7.1% | +2.2% |
| Precious Metals (Gold) | +11.8% | +4.2% | +7.6% |
| Timber / Farmland | +7.9% | +5.8% | +2.1% |
Source: PGIM Multi-Asset Solutions analysis (1971–2024), reproduced with attribution; the same analysis characterises commodities as having the strongest positive sensitivity to inflation surprises among these asset classes, described here qualitatively rather than as a numeric correlation. High inflation defined as periods 2+ pp above trailing 4Q average.
Commodities have exhibited strong positive sensitivity to inflation and relatively high correlations with inflation surprises, with the relationship strengthening since 2020 as energy and supply-chain shocks fed through to core prices; returns, however, display high volatility. Energy-heavy allocations outperformed during supply-driven inflation (1970s, 2021–22, and again in 2026: in March 2026, Brent recorded its largest monthly gain on record, in what the World Bank and IEA describe as the largest oil supply shock in history, following Iran's formal announcement on 4 March of the closure of the Strait of Hormuz), while industrial metals outperformed during demand-driven episodes. Gold, at around $4,435 per ounce at end of August 2026 (August 31), has continued to behave as a hedge against both geopolitical and inflation risk. Real estate and infrastructure provide more stable inflation protection through contractual inflation escalators in leases and regulated revenue streams.
05
Allocation Strategy
Portfolio Construction
Across Regimes
Optimal portfolio construction requires explicit consideration of expected inflation regime. Research demonstrates that allocations optimised for one regime can perform poorly in others, with particularly stark differences between low inflation and high inflation environments.
| Asset Class | Low Inflation | High & Rising | High & Falling | Transitional |
|---|---|---|---|---|
| Equities (Total) | 60% | 35% | 50% | 45% |
| Growth Equities | 35% | 5% | 15% | 15% |
| Value Equities | 15% | 15% | 20% | 15% |
| Quality / Dividend | 5% | 10% | 10% | 10% |
| International / EM | 5% | 5% | 5% | 5% |
| Fixed Income (Total) | 35% | 20% | 35% | 30% |
| Nominal Bonds | 25% | 5% | 20% | 12% |
| TIPS | 5% | 8% | 8% | 10% |
| Floating Rate | 0% | 5% | 3% | 4% |
| Credit / HY | 5% | 2% | 4% | 4% |
| Real Assets (Total) | 5% | 35% | 10% | 20% |
| Commodities | 0% | 15% | 3% | 8% |
| Real Estate / REITs | 3% | 12% | 4% | 7% |
| Infrastructure | 2% | 8% | 3% | 5% |
| Cash / Alternatives | 0% | 10% | 5% | 5% |
Source: Britannica Capital Research, incorporating research from PGIM, Russell Investments, T. Rowe Price.
Implementation Considerations
Investment Horizon Matters: For short-horizon investors in high inflation regimes, the framework favours cash and floating rate instruments. Long-horizon investors have historically benefited from maintaining equity and real asset exposure despite near-term volatility.
Regime Identification: Inflation regimes are most clearly identified in retrospect. Monitoring multiple indicators—expectations, monetary policy, wage growth, commodity prices—is essential.
Transaction Costs: Optimal implementation balances regime responsiveness against trading costs, typically using semi-annual or quarterly rebalancing with tactical tilts within strategic ranges.
06
September 2026
Current Market
Positioning
Our assessment in February 2026 anticipated a transition from a "high & falling" regime toward "low & stable" conditions. That path was interrupted by the energy shock that followed the outbreak of the Middle East conflict on 28 February 2026 and Iran's formal announcement on 4 March of the closure of the Strait of Hormuz. The global economy now sits in a transitional regime with headline inflation re-accelerating, core measures sticky in the 2.5–3.5% band, and major central banks having shifted from easing to a tightening bias: the Federal Reserve has held at 3.50–3.75% for five consecutive meetings with three July dissents in favour of a hike, the ECB raised its deposit rate to 2.25% in June, and the Bank of England has held at 3.75% on a 6–3 vote. Regional divergence remains meaningful.
Regime Probabilities (12-Month Forward)
Low & Stable — Inflation 1.5–2.5%
15%
Transitional — Inflation 2.5–3.5%
40%
High & Rising — Inflation >3.5%
35%
Deflation Risk — Recession with falling prices
10%
Key Assessment Factors
- Inflation Trajectory: U.S. core PCE 3.3% and headline PCE 3.7% y/y in July 2026 (BEA), up from 2.7% core PCE in early 2026; headline CPI 3.4% and core CPI 2.5% y/y in July 2026 (BLS); energy CPI +14.7% y/y (BLS)
- Labour Market: Unemployment 4.1% in July 2026; payrolls fell 23,000; average hourly earnings +3.2% y/y, the slowest since 2021; participation 61.4%. Wage pressure is easing even as headline prices rise
- Monetary Policy: Fed at 3.50–3.75%, unchanged for five meetings, three July dissents for a 25bp hike; June projections put core PCE at 3.3% (2026) and 2.5% (2027). Futures priced roughly even odds of a hike at the 15–16 September meeting after the Chair's Jackson Hole remarks. ECB deposit rate 2.25% after a June hike; Bank Rate 3.75%
- Energy & Supply Chains: Strait of Hormuz flows around 6–8 mb/d versus ~20 mb/d pre-conflict; Brent near $91–96 in late August/early September versus a March peak above $120. NY Fed supply chain index eased to 0.79 in July from 1.19
- Tariff Risk: IEEPA tariffs struck down by the Supreme Court on 20 February 2026; a 10% Section 122 global tariff ran 24 February–24 July and was replaced by Section 301 measures. Average statutory rate 11.0% as of 24 August, rising to 11.8% by year-end under current law (The Budget Lab at Yale)
- Housing Lag: Shelter CPI 3.2% y/y in July 2026 and still contributing about two-thirds of the monthly core increase; asking rents +2.3% y/y, the fastest pace in over a year (Zillow)
- Expectations: University of Michigan Surveys of Consumers (final August 2026): year-ahead inflation expectations 4.0% (down from 4.2%; lowest since March, but still well above the 3.4% pre-war baseline of February 2026) and 5-year expectations 3.3% (unchanged for a third consecutive month); the sentiment index fell to 51.7 from 55.2 in July, avoiding a re-test of the May 2026 low of 44.8. 10-year breakeven near 2.3% (FRED). Market-based measures remain anchored; survey measures remain elevated relative to the pre-war baseline
Illustrative Regime-Aware Allocation (Not a Recommendation)
Base Case: In a transitional regime, an illustrative regime-aware framework would weight roughly 45% equities, 30% fixed income, 20% real assets and 5% cash. Such a mix provides inflation protection if the high & rising scenario becomes entrenched while retaining equity participation if the energy shock fades and disinflation resumes. These are illustrative analytical constructs for institutional readers; they are not Britannica Capital positions and not advice to any reader.
Equities: Within equities, the framework favours value and dividend sectors with pricing power (Financials, Healthcare, select Industrials) over pure growth and long-duration technology, with an energy weighting in the 5–7% range as an inflation hedge, recognising that the sector's 2026 outperformance has already been substantial.
Fixed Income: In fixed income, the framework carries an inflation-linked allocation (TIPS around 10%), a floating-rate sleeve (around 4%) and nominal duration modestly below neutral (4–5yr vs. a 6–7yr benchmark) while the policy bias remains toward tightening.
Real Assets: Real assets sit at an elevated 20% in the illustrative mix: commodities about 8% (diversified), real estate about 7% (core + data centres), infrastructure about 5% (regulated utilities).
07
Stress Testing
Scenario Analysis &
Return Projections
| Scenario | Prob. | Regime-Aware Portfolio (Illustrative) | Traditional 60/40 | Outperformance |
|---|---|---|---|---|
| Soft Landing (energy shock fades; disinflation resumes) | 15% | +7.8% ann. | +8.4% ann. | -0.6% |
| Muddle Through (sticky 2.5–3.5%) | 40% | +6.2% ann. | +5.1% ann. | +1.1% |
| Re-acceleration (headline sustained at 4–5%) | 35% | +3.1% ann. | -1.2% ann. | +4.3% |
| Recession with Deflation | 10% | +1.4% ann. | +2.8% ann. | -1.4% |
| Expected Return (prob-weighted) | 100% | +4.9% ann. | +3.2% ann. | +1.7% |
Source: Britannica Capital projections as of September 2026. Scenario probabilities updated from February 2026 (45/35/15/5) to reflect the 2026 energy shock; scenario return assumptions unchanged. Returns are nominal, illustrative and assume rebalancing. 60/40 = 60% S&P 500, 40% Bloomberg Agg.
Scenario Insights
The regime-aware allocation sacrifices approximately 60bp of return in the soft landing scenario relative to traditional 60/40, primarily due to lower equity weight and real asset drag. However, it demonstrates superior downside protection in both the re-acceleration (+4.3% outperformance) and muddling-through scenarios. With the probability of re-acceleration raised from 15% to 35% following the 2026 energy shock, the probability-weighted advantage over 60/40 widens from roughly 70bp in the February analysis to approximately 170bp, with substantially better risk-adjusted outcomes.
08
Conclusion
Investment Implications
& Key Takeaways
"The relationship between inflation regimes and market outcomes represents one of the most robust and empirically supported patterns in financial history. Asset classes demonstrate strikingly different performance characteristics across inflation environments, making regime-aware portfolio construction essential."Britannica Capital Research, September 2026
Key Takeaways
◆
Regime Framework Essential — Direction and persistence of inflation trends matter more than absolute levels for portfolio outcomes.
◆
Real Assets Are Not Optional — 15–20% allocation provides essential insurance against unexpected inflation re-acceleration.
◆
Factor Rotation Within Equities — Emphasise value, quality, and dividend factors during transitional and high inflation regimes.
◆
Fixed Income Diversification — Supplement nominal bonds with TIPS, floating rate, and shorter duration when inflation risks are elevated.
◆
Dynamic Rebalancing — Disciplined response to changing dynamics can enhance risk-adjusted returns by 100–180bp annually.
◆
Growth-Inflation Interaction — Optimal positioning depends on the joint distribution of growth and inflation, not inflation alone.
◆
Regional Divergence — Account for varying trajectories: energy-led re-acceleration in the U.S. and euro area compounded by U.S. tariffs, a smaller UK energy pass-through, near-zero inflation in China, and paused easing cycles across emerging markets.
While the framework still assigns the largest single probability to inflation settling in a transitional 2.5–3.5% band rather than becoming entrenched above 4%, the events of 2026 have demonstrated that the asymmetric risks of inflation re-acceleration warrant portfolio insurance through strategic real asset allocations and tactical flexibility. Investors who successfully navigate regime transitions while maintaining discipline through volatility are positioned to preserve purchasing power and generate real returns across diverse macroeconomic outcomes.
09
Monitoring
Inflation Regime
Dashboard
| Indicator Category | Key Metrics | Frequency | Significance |
|---|---|---|---|
| Actual Inflation | CPI, Core CPI, PCE, Core PCE | Monthly | Realised inflation; lagging indicator |
| Inflation Expectations | 5y5y Forward, TIPS Breakevens, SPF, Michigan Survey | Daily / Quarterly | Market and consumer expectations; regime transition signal |
| Wage Pressures | Average Hourly Earnings, ECI, Wage Trackers | Monthly / Quarterly | Labour cost pressures; leading services inflation indicator |
| Commodity Prices | CRB Index, Oil, Industrial Metals, Agriculture | Daily | Input cost pressures; goods inflation signal |
| Supply Chain | NY Fed Supply Chain Index, Shipping Costs, PMI Delivery | Monthly | Supply-side inflation pressures |
| Monetary Policy | Policy Rates, Forward Guidance, Balance Sheet Size | Meeting-based | Central bank inflation fighting commitment |
| Market Pricing | Fed Funds Futures, Inflation Swaps, Option-Implied Vol | Daily | Market regime probabilities |
Regime transition signals emerge when multiple indicators shift coherently. No single indicator provides sufficient evidence for major portfolio adjustments.
Sources & Methodology
This report synthesises research and data from the U.S. Bureau of Economic Analysis (Personal Income and Outlays, July 2026, released 26 August 2026; GDP second estimate, Q2 2026), U.S. Bureau of Labor Statistics (Consumer Price Index and Employment Situation, July 2026), Federal Reserve Board (FOMC statement, 29 July 2026; Summary of Economic Projections, June 2026; Jackson Hole remarks, 28 August 2026), Federal Reserve Bank of New York (Global Supply Chain Pressure Index, July 2026; Adrian-Crump-Moench (ACM) term premium estimates, August 2026), Federal Reserve Economic Data (FRED series DGS10 and T10YIE), World Bank and International Energy Agency (oil market commentary, 2026), International Monetary Fund (World Economic Outlook Update, July 2026, and World Economic Outlook, April 2026), Eurostat (HICP flash estimate, August 2026), European Central Bank (monetary policy decisions, June and July 2026), Office for National Statistics (Consumer price inflation, July 2026; August released 16 September), Bank of England (Monetary Policy Report, July 2026), National Bureau of Statistics of China (CPI, July 2026; August released around 9 September), The Budget Lab at Yale (State of U.S. Tariffs, 24 August 2026), University of Michigan Surveys of Consumers (final August 2026), Zillow Rental Market Report (July 2026), S&P Dow Jones Indices sector data, PGIM Multi-Asset Solutions (real-assets analysis, 1971–2024), Russell Investments, T. Rowe Price (fixed-income regime analysis based on Bloomberg/Federal Reserve data with proxy series), Schroders, MSCI, BlackRock, Vanguard, Morningstar, and proprietary Britannica Capital analysis. Historical performance data spans 1927–2025 where available, with primary focus on the 1970–2025 period for inflation regime analysis. Market levels are as of 28 August–3 September 2026 unless otherwise stated.
Important Disclosures
This research report is provided for informational purposes only and does not constitute investment advice, a recommendation, or a solicitation to buy or sell any securities. Past performance is not indicative of future results. All investments involve risk, including possible loss of principal. The information contained herein is based on sources believed to be reliable, but Britannica Capital makes no representation or warranty as to its accuracy or completeness. Economic and market forecasts are subject to uncertainty and may change based on varying market conditions. The views expressed herein are those of the Britannica Capital Research as of September 1, 2026, and are subject to change without notice.