A Practical Framework
Building a systematic risk-on/risk-off dashboard to identify regime shifts, time tactical positioning, and manage portfolio exposure across market cycles.
Risk-On vs Risk-Off Classification
A systematic dashboard integrating Federal Reserve liquidity, credit spreads, equity internals, and cross-asset flows into explicit regime classifications that inform position sizing rather than entry/exit timing.
Spread Dynamics & Distress Ratios
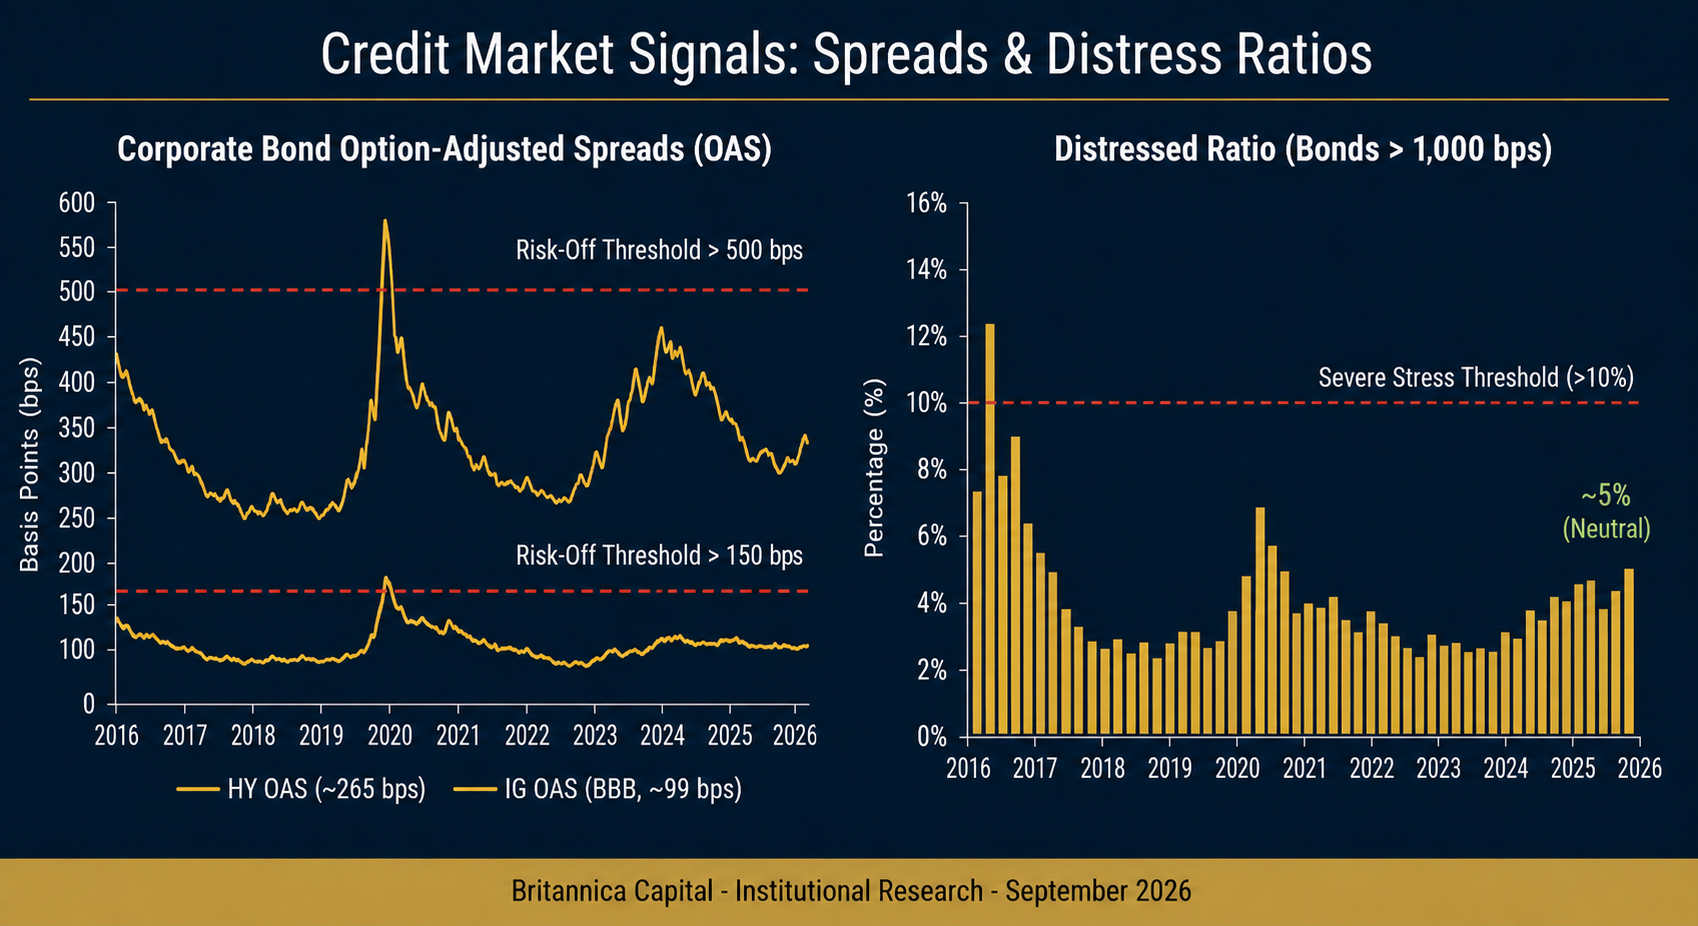
Credit markets reveal private sector willingness to supply capital. Investment-grade and high-yield spread movements, distress ratios, and issuance patterns serve as leading indicators of financial conditions tightening or easing.
Fed Balance Sheet & Reserve Dynamics
Central bank actions determine base money availability. Reserve balances, RRP facility usage, TGA fluctuations, and QT pace collectively shape the liquidity backdrop that drives risk asset behaviour across cycles.
Tactical Positioning Rules
Translating dashboard readings into actionable allocation adjustments. Regime-dependent equity exposure sizing, credit hedge calibration, and systematic rebalancing triggers designed for institutional portfolio management.
This document is for informational and educational purposes only and does not constitute investment advice, a recommendation, or a solicitation. All performance figures represent hypothetical backtests conducted before transaction costs, slippage, and implementation frictions. Past hypothetical performance is not indicative of future results. Market conditions, indicator relationships, and regime definitions may change. Investors should conduct independent analysis and consult qualified professionals before making investment decisions. Britannica Capital assumes no liability for decisions based on this framework.
Understanding Financial Conditions
Financial conditions determine how easily capital flows through markets and into the real economy. Loose financial conditions promote risk-taking, support asset price expansion, and encourage credit growth. Tight financial conditions restrict capital availability, expand risk premiums, and force portfolio de-risking. Understanding the current regime and detecting shifts early provides institutional investors with tactical advantages in positioning, hedging, and capital allocation decisions.
Traditional approaches to measuring financial conditions suffer from several limitations. Single indicators provide incomplete pictures and generate false signals. Ad hoc interpretation introduces subjective bias and inconsistent application. Backward-looking metrics react too slowly to regime changes. This report presents a systematic framework for constructing a multi-indicator dashboard that addresses these shortcomings through disciplined aggregation and explicit regime classification.
The framework integrates signals from Federal Reserve liquidity provision, credit market pricing, equity market internals, and cross-asset flows into a coherent assessment of prevailing financial conditions. Each component captures distinct aspects of market functioning: central bank actions determine the availability of base money; credit markets reveal private sector willingness to supply capital; equity internals measure risk appetite; cross-asset flows identify defensive positioning. Combining these indicators systematically reduces noise while preserving information about regime transitions.
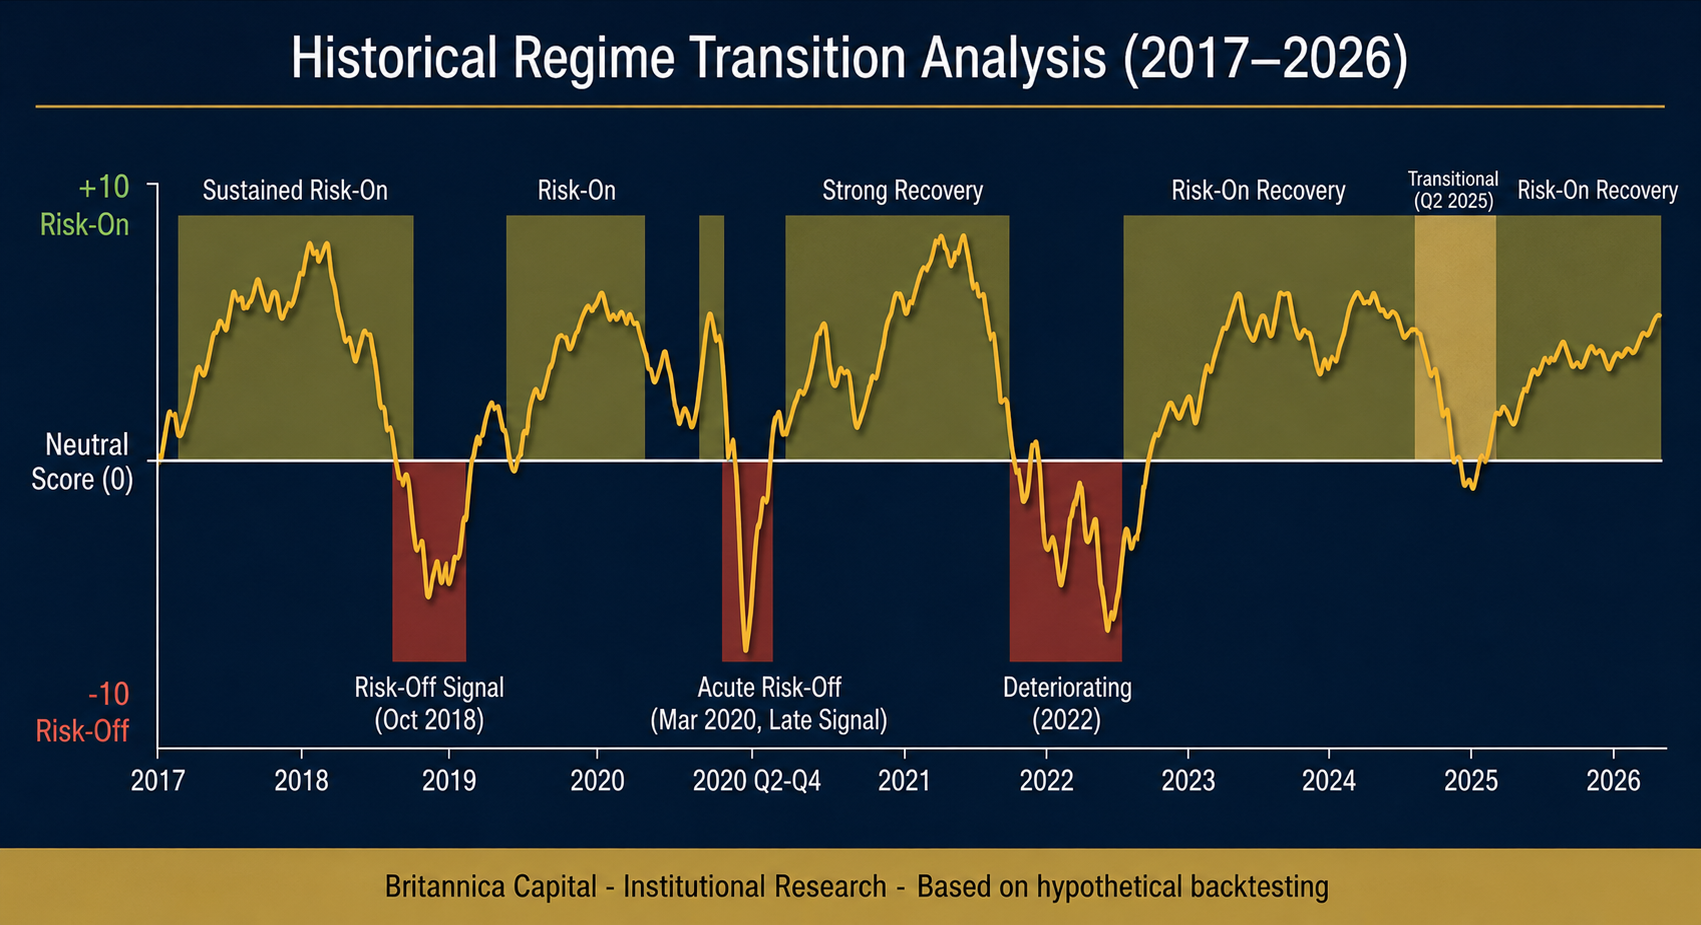
Historical analysis demonstrates the framework's potential utility. In historical samples covering 2016-2025, deteriorating dashboard readings often coincided with or preceded equity drawdowns, though lead times varied considerably across episodes (ranging from concurrent signals in March 2020 to several weeks advance warning in 2018 Q4). Risk-on regime readings tended to align with sustained rallies in 2017, 2019-2020, and 2023-2025. The framework aims to generate actionable signals without requiring heroic forecasting or market timing precision, though forward-looking performance may differ from historical patterns.
Financial conditions frameworks work because they aggregate independent information channels into regime classifications that inform position sizing rather than entry/exit timing. The goal is not perfect market timing but systematic adjustment of portfolio risk exposure to align with prevailing conditions. Risk-on environments justify higher equity exposure, narrower credit spreads, and reduced hedging costs. Risk-off environments demand defensive positioning, wider hedges, and reduced leverage.
Unless otherwise specified, price data reflects closing levels; percentage changes are calculated on a trailing 20-day or 60-day basis as noted; credit spreads are option-adjusted spreads to US Treasuries; equity flows represent net creation/redemption in ETF structures; all Federal Reserve data sourced from H.4.1 weekly releases. Regime classifications updated weekly based on latest available data as of Friday close. Indicator thresholds were calibrated to post-2010 market conditions and are reviewed annually for continued relevance. Framework methodology as of September 2026; dashboard readings reflect data through late August 2026, and specific market levels vary daily.
Risk-On / Risk-Off Framework
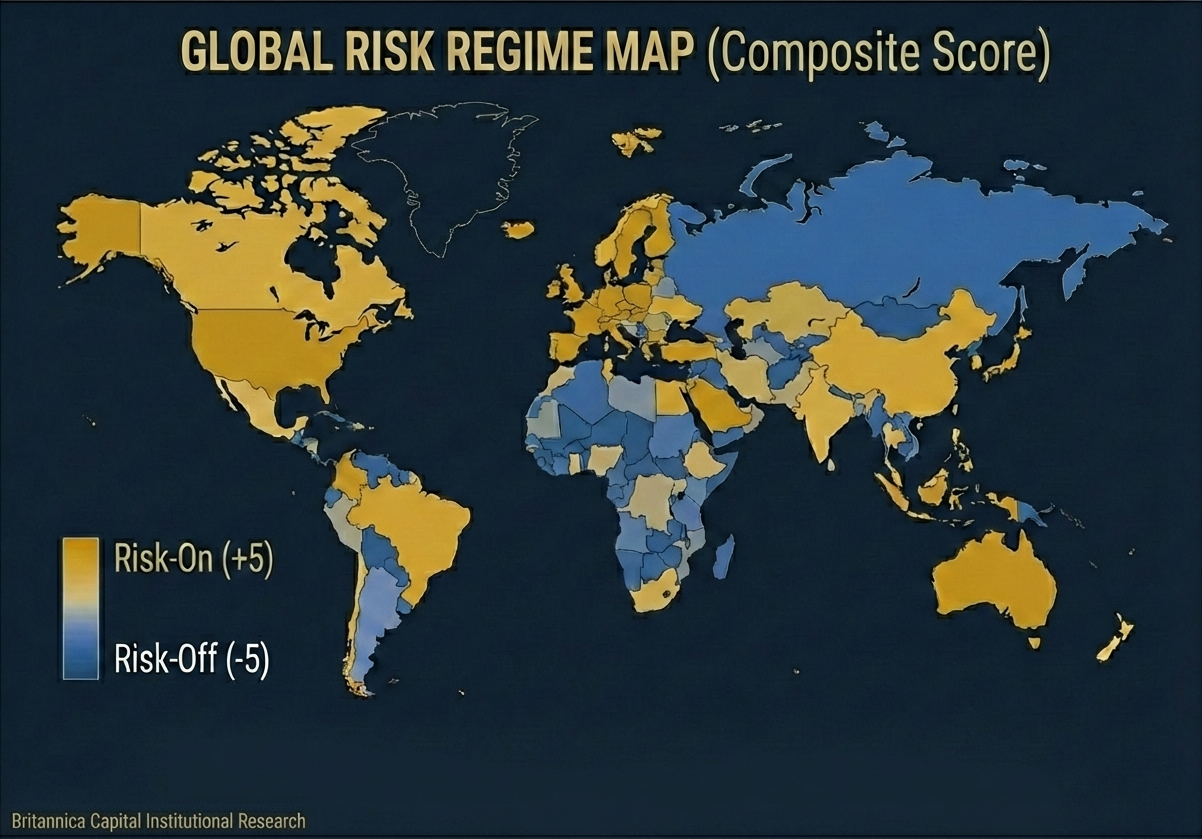
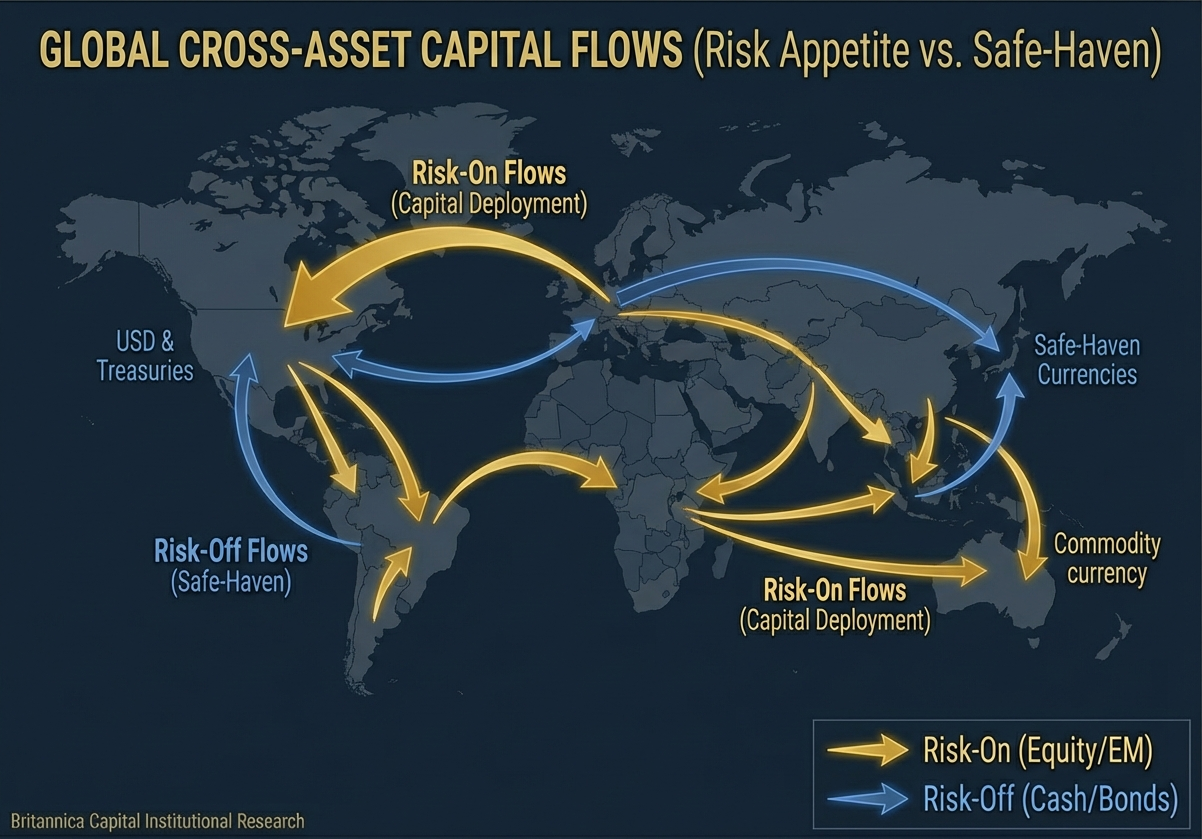
The risk-on/risk-off framework categorizes market environments based on investor willingness to hold risky assets. Risk-on regimes feature rising equity prices, narrowing credit spreads, outperformance of cyclical sectors, currency strength in commodity exporters, and declining volatility. Risk-off regimes show the opposite pattern: falling equities, widening spreads, defensive sector leadership, safe-haven currency strength, and elevated volatility.
These patterns emerge from shifts in liquidity availability and risk appetite. When central banks provide abundant liquidity and economic uncertainty is low, investors bid up risk assets. When liquidity contracts or uncertainty increases, investors retreat to safety. The framework codifies these relationships through systematic monitoring of leading indicators that signal regime changes before they fully manifest in broad market indices.
Effective implementation requires distinguishing signal from noise. Not every credit spread widening episode indicates regime change. Not every equity rally signals sustained risk-on conditions. The framework addresses this challenge through multiple independent confirmation, requiring alignment across several indicator categories before declaring regime shifts.
| Market Segment | Risk-On Characteristics | Risk-Off Characteristics |
|---|---|---|
| Equity Markets | Broad participation, strong internals, low vol | Narrow leadership, weak breadth, high vol |
| Credit Markets | Tight spreads, HY outperformance, new issuance | Wide spreads, flight to quality, issuance drought |
| Currency Markets | EM/commodity currency strength, USD weakness | JPY/CHF strength, USD strength, EM pressure |
| Volatility Markets | Low VIX, positive vol risk premium, low skew | High VIX, elevated put skew, negative premium |
| Commodity Markets | Industrial metals strength, energy demand | Gold outperformance, industrial weakness |
Risk-on/risk-off frameworks perform poorly during stagflationary regimes where inflation concerns conflict with growth weakness, creating mixed signals across asset classes. They also struggle during major structural transitions like COVID-19 where unprecedented policy responses distorted normal relationships. Users should recognize these limitations and supplement the framework with fundamental economic analysis during ambiguous periods. The 2026 backdrop — headline inflation still well above target, sub-2% growth, an energy supply shock, and equity indices at record highs — is precisely such a period, and the framework's readings should be weighed accordingly.
Federal Reserve Liquidity Provision
Federal Reserve liquidity provision represents the foundation of financial conditions. Changes in the Fed's balance sheet directly impact monetary base availability and influence interest rates across the yield curve. Quantitative easing expands liquidity, supporting asset prices and encouraging risk-taking. Quantitative tightening withdraws liquidity, creating headwinds for risk assets.
The rate of change matters more than absolute levels. Markets adapt to stable Fed balance sheet sizes but react to acceleration or deceleration in growth rates. A $95 billion monthly reduction in Treasury and MBS holdings (the pace during 2022-2023 QT) creates different conditions than a stable balance sheet. Similarly, emergency liquidity expansion during crises has immediate market impact regardless of starting balance sheet size.
Beyond balance sheet mechanics, Fed communication shapes financial conditions through forward guidance and policy rate expectations. Hawkish rhetoric tightens conditions even before actual rate hikes materialize. Dovish signals loosen conditions by reducing risk-free rate expectations and compressing term premiums. Systematic tracking of Fed actions and communication provides early warning of liquidity regime shifts.
Key Monitoring Metrics
Signal Interpretation
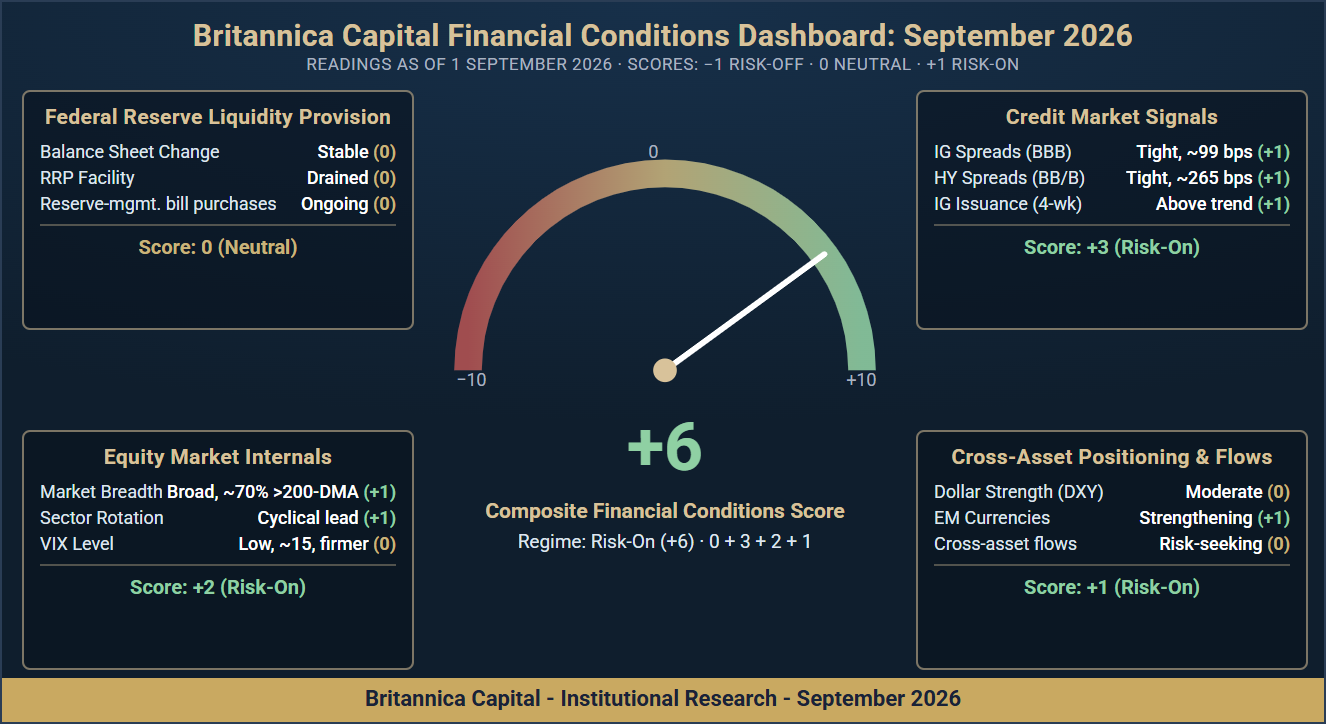
Balance sheet runoff ended on 1 December 2025 and the Federal Reserve has since conducted reserve management purchases of Treasury bills — roughly $40 billion per month initially, stepped down to about $10 billion per month after the April 2026 tax season, alongside reinvestment of agency MBS principal into bills. Total assets stood near $6.73 trillion on 26 August 2026, reserve balances near $2.92 trillion (about $300 billion lower than a year earlier), the Treasury General Account near $950 billion, and overnight reverse repo usage below $10 billion — the RRP buffer that cushioned 2023-2024 tightening is exhausted. SOFR has printed at or close to the 3.65% interest-on-reserves rate and the Standing Repo Facility has seen only token use. Money market fund assets were about $7.9 trillion (ICI, week ended 26 August), and the Chicago Fed NFCI read −0.56 in the week ended 28 August, looser than its long-run average. The policy rate has been held at 3.50-3.75% since December 2025, with three July dissents in favour of a hike; Chair Warsh's 28 August Jackson Hole remarks were read as hawkish, and market pricing shifted toward a possible increase at the 15-16 September meeting. Abroad, the ECB raised its deposit rate to 2.25% in June, the Bank of England held Bank Rate at 3.75% (6-3, with dissents for a hike) and the Bank of Japan held at 1.0%, with further tightening priced for September. The US Treasury has also announced enlarged buybacks of off-the-run long-dated debt from 9 September. Net: the liquidity category reads neutral — the balance sheet is stable to modestly growing, but the rate path has tilted toward tightening and the RRP shock absorber is gone.
Credit Market Signals
Credit markets provide critical information about financial conditions through corporate bond spreads, issuance volumes, and relative performance across quality tiers. Unlike equity markets where animal spirits can drive extended momentum, credit investors face asymmetric payoffs that encourage conservative risk assessment. When sophisticated credit investors demand wider spreads and reduce new lending, financial conditions are genuinely tightening regardless of equity market behavior.
Investment grade and high yield spreads capture different aspects of financial conditions. IG spreads reflect corporate sector health and general risk appetite with relatively low default risk. HY spreads incorporate meaningful default probability and show greater sensitivity to recession fears. The ratio between HY and IG spreads (the credit quality spread) signals investor discrimination between safe and risky credits.
Primary market issuance provides complementary information. Robust new issuance indicates corporations can access capital markets at acceptable costs and investors maintain appetite for adding credit exposure. Issuance droughts signal either prohibitive spreads or investor unwillingness to deploy capital, both indicating tight financial conditions. Tracking both secondary spreads and primary issuance creates comprehensive credit market surveillance.
Historical analysis suggests IG spreads exceeding 150bps and HY spreads above 500bps indicate transitioning to risk-off conditions, while IG below 90bps and HY below 300bps signal extended risk-on environments. Distressed debt ratios (bonds trading at 1000+ bps spreads) exceeding 10% of the HY market indicate severe stress. Current levels as of September 2026 (BBB ~99bps, HY ~265bps) suggest risk-on conditions in public credit markets, with high-yield spreads inside the extended-risk-on boundary. The signal is tempered by a distressed tail that has grown relative to headline spreads and by redemption pressure in private credit noted in the July 2026 FOMC minutes, which is why the distressed-ratio row is scored neutral rather than risk-on.
Equity Market Internals
Equity market internals reveal the underlying health of rallies and selloffs through breadth indicators, sector rotation patterns, and volatility structure. Headline index performance can mask deteriorating or improving internals that forecast regime changes. Sustainable risk-on environments feature broad participation with advancing issues outnumbering decliners, cyclical sector leadership, and compressed volatility. Deteriorating breadth despite rising indices warns of fragile conditions vulnerable to reversal.
The advance-decline line compares cumulative advances versus declines across index constituents. Divergences between the A-D line and price indices signal weakening participation. An index making new highs while the A-D line trends lower indicates narrow leadership that rarely persists. Conversely, A-D lines making new highs before price indices often precede sustained breakouts.
Sector rotation provides additional regime information. Cyclical sectors (financials, industrials, materials) outperform during risk-on periods when growth expectations strengthen. Defensive sectors (utilities, consumer staples, healthcare) outperform during risk-off periods when investors prioritize stability. The relative performance of discretionary versus staples specifically captures consumer health and risk appetite shifts.
Percentage of stocks above 50-day and 200-day moving averages quantifies internal strength. Risk-on environments typically show 60%+ of S&P 500 constituents above both moving averages. Readings below 40% indicate deteriorating conditions. Current readings provide early warning of regime transitions before major index moves.
VIX levels below 15 indicate complacency supporting risk-on positioning, while readings above 25 signal elevated uncertainty. VIX term structure inversion (front months trading above back months) specifically warns of acute near-term stress inconsistent with sustained risk-on conditions.
Currency & Cross-Asset Flows
Currency markets and cross-asset flows reveal global risk sentiment through capital allocation patterns across borders and asset classes. The US dollar's role as the world's reserve currency makes its strength or weakness a powerful financial conditions indicator. Dollar weakness typically accompanies risk-on environments as investors deploy capital internationally and reduce safe-haven allocations. Dollar strength signals risk-off positioning with capital repatriating to US Treasuries and cash.
Japanese yen and Swiss franc serve as definitive safe-haven currencies due to persistent current account surpluses and low policy rates enabling carry trade structures. JPY and CHF strength indicates unwinding of leveraged positions and flight to safety. Their weakness suggests investors remain comfortable with risk exposure and maintain carry positions. The USD/JPY exchange rate specifically captures risk appetite shifts given Japan's role as a major funding currency. In early August 2026 Japanese authorities intervened after USD/JPY reached multi-decade highs above ¥163; the pair subsequently traded near ¥160. Intervention episodes carry carry-trade unwind risk, which argues for treating the yen signal as neutral rather than risk-on for now.
Commodity currency performance (AUD, CAD, NOK) provides additional confirmation. These currencies benefit from strong commodity prices and risk-on conditions supporting emerging market demand. Their underperformance often precedes broader risk-off episodes as commodity demand weakens and investors reduce EM exposure. Emerging market currency indices aggregate these signals across developing economies.
| Currency / Asset | Risk-On Signal | Risk-Off Signal | Sept 2026 Status |
|---|---|---|---|
| DXY (Dollar Index) | Weakening, <100 | Strengthening, >105 | Neutral |
| USD/JPY | Rising (JPY weakness) | Falling (JPY strength) | Neutral |
| Gold ($/oz) | Declining, below 200-day average | Rising, new highs | Risk-Off |
| EM Currency Index | Strengthening vs USD | Weakening vs USD | Risk-On |
| Copper ($/lb) | Rising, new cycle highs | Falling, below 200-day average | Risk-On |
ETF creation and redemption data captures retail and institutional positioning. Sustained equity ETF inflows exceeding $10B weekly indicate strong risk appetite, while redemptions signal defensive positioning. Bond ETF flows show similar patterns with investment-grade inflows during risk-off episodes and high-yield inflows during risk-on periods. Combined equity and fixed income flow analysis provides comprehensive view of capital allocation trends.
Building a Composite Framework
Composite dashboard construction aggregates individual indicators into coherent regime assessments through systematic scoring and threshold rules. Each indicator receives a score based on its current reading relative to historical ranges and regime-defining thresholds. Aggregate scores across categories determine overall financial conditions classification.
A simple scoring methodology assigns +1 for risk-on signals, 0 for neutral, and -1 for risk-off signals. Summing scores across all indicators produces a composite reading. Scores above +5 indicate strong risk-on conditions. Scores between -5 and +5 suggest mixed or transitional conditions. Scores below -5 signal risk-off environments. This approach provides clear decision rules while acknowledging ambiguous middle regimes.
Equal weighting across major categories (Fed liquidity, credit markets, equity internals, cross-asset flows) prevents any single indicator from dominating the composite. Within categories, individual indicators receive equal weight unless fundamental reasons justify differential treatment. For example, HY spreads may receive higher weight than IG spreads given greater sensitivity to financial stress.
Composite scores provide regime classification but require judgment in application. Scores near zero indicate transitional periods where position adjustments should be modest and reversible. Strong readings (+7 or higher, -7 or lower) justify conviction positioning. The September 2026 reading of +6 sits just inside risk-on territory; the Fed liquidity category is the swing factor, and a resumption of policy tightening would pull the composite back toward neutral. Historical back-testing suggests composite scores would have typically led major market turning points by 2-6 weeks on average, providing potentially sufficient time for portfolio adjustments without requiring perfect timing. However, forward-looking predictive power may differ from historical patterns, and implementation costs reduce theoretical benefits.
Regime Detection Methodology
Effective regime detection balances responsiveness against whipsaw risk. Overly sensitive frameworks generate excessive trading signals that create transaction costs without improving outcomes. Insufficiently responsive frameworks lag regime changes and miss positioning opportunities. The optimal approach incorporates confirmation requirements and smoothing techniques that filter noise while preserving genuine signals.
Confirmation rules require multiple consecutive periods of regime-consistent readings before declaring regime changes. A single week of risk-off signals does not justify complete portfolio restructuring. Three consecutive weeks of deteriorating conditions across multiple categories provides stronger evidence of genuine regime transition. This confirmation approach reduces false positives while maintaining reasonable responsiveness to actual changes.
Moving average smoothing of individual indicators reduces day-to-day volatility that generates false signals. A 4-week or 12-week moving average of credit spreads provides cleaner regime information than daily levels. Similarly, tracking percentage of time above/below thresholds over rolling windows captures trend direction without excessive sensitivity to single-day movements.
Detection Parameters
Common False Signals
The framework's value depends on systematic application without subjective override during uncomfortable periods. The strongest temptation to ignore signals occurs when they conflict with prevailing narrative or recent performance. Maintaining discipline during these periods generates the framework's alpha. Historical analysis shows overridden signals would have prevented significant drawdowns in 2018 and 2022.
Historical Regime Analysis
Historical back-testing demonstrates the framework's potential utility across various market environments. The analysis examines major regime transitions since 2016, evaluating whether the composite dashboard would have provided advance warning and whether recommended positioning adjustments could have improved risk-adjusted returns in hindsight.
The 2018 Q4 selloff exemplifies hypothetical risk-off detection. The composite score would have deteriorated from +6 in September 2018 to -5 by mid-October as Fed balance sheet reduction accelerated, credit spreads widened, and equity breadth weakened. The S&P 500 subsequently fell 19.8% from September peak to December trough. Investors hypothetically following the framework would have received signals to reduce equity exposure in October, potentially avoiding some of the drawdown, though actual implementation timing and costs would have affected results.
March 2020 presented more challenging conditions. The composite score would have remained in mild risk-on territory (+3) through mid-February 2020 before collapsing to -9 in the first week of March. The framework would have provided only 1-2 weeks of advance warning before the full crisis manifestation. However, even this limited warning could have enabled partial defensive positioning before the worst declines, though execution during market stress would have been difficult.
| Period | Regime Signal | S&P 500 Performance | Signal Quality |
|---|---|---|---|
| 2017 | Sustained Risk-On (+7 avg) | +21.8% total return | Accurate |
| 2018 Q4 | Risk-Off (-5 by Oct) | −19.8% peak to trough | Accurate |
| 2019 | Recovery to Risk-On | +31.5% total return | Accurate |
| Mar 2020 | Acute Risk-Off (-9) | −33.9% peak to trough | Late Signal |
| 2020 Q2-Q4 | Strong Risk-On (+8 avg) | +68.0% from March low | Accurate |
| 2022 | Deteriorating (0 to -4) | −18.1% total return | Accurate |
| 2023-2024 | Risk-On recovery (+5 avg) | +26.3% (2023), +25.0% (2024) | Accurate |
| 2025 | Transitional in Q2 (tariff shock), then Risk-On | +17.9% total return | Mixed |
Hypothetical backtests over 2016-2025 using this framework for tactical positioning adjustments would have historically generated Sharpe ratio improvements of approximately 0.2-0.4 versus buy-and-hold, before transaction costs, slippage, and implementation frictions. Results represent simulated performance with perfect hindsight on indicator thresholds. Actual implementation would have incurred costs reducing net returns. Most simulated outperformance came from drawdown mitigation during risk-off periods rather than return enhancement during rallies. Past hypothetical performance does not guarantee future results.
Implementation Guide
Translating framework signals into portfolio actions requires pre-established rules linking composite scores to position sizing adjustments. Discretionary interpretation creates inconsistent application and emotional override during stress. Rule-based implementation ensures the framework influences actual portfolios rather than serving merely as interesting market commentary.
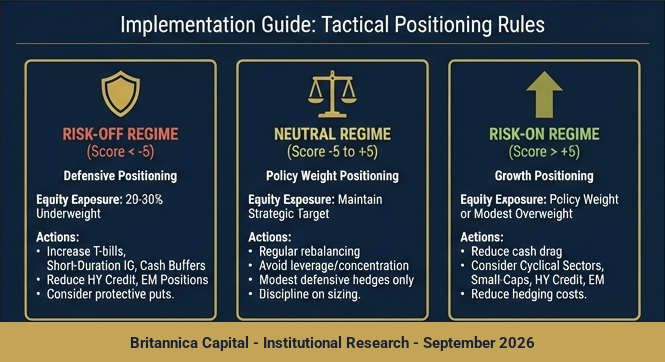
A practical approach establishes baseline equity exposure targets for each regime. Risk-on regimes (composite score +5 or higher) justify policy weight or modest overweight equity positions. Neutral regimes (composite score -5 to +5) warrant policy weight equity exposure. Risk-off regimes (composite score below -5) justify 20-30% underweight equity positions with corresponding increases in cash and high-quality fixed income.
Implementation also considers portfolio constraints and investor circumstances. Long-only mandates cannot reduce equity exposure below certain thresholds. Tax-sensitive accounts face different trading constraints than institutional portfolios. Illiquid positions require earlier adjustment than liquid ETF holdings. The framework provides the signal; implementation details reflect specific investor requirements.
Defensive Positioning
Reduce equity exposure 20-30% below policy weight. Increase allocation to T-bills, short-duration IG bonds, and developed market sovereign debt. Consider protective put strategies on equity exposure. Reduce or eliminate high-yield credit and emerging market positions. Maintain higher cash buffers for opportunistic deployment.
Policy Weight Positioning
Maintain strategic asset allocation targets without tactical adjustments. Avoid adding leverage or concentration. Regular rebalancing back to policy weights. Modest defensive hedges justified but avoid expensive protection. Maintain discipline on position sizing without conviction bets in either direction.
Growth Positioning
Policy weight or modest overweight equity exposure justified. Reduce cash drag and defensive positions. Consider cyclical sector overweights and small-cap exposure. High-yield credit and emerging markets appropriate. Reduce expensive hedging costs. Maintain risk discipline but allow full participation in rallies.
Position changes should implement gradually over 1-2 weeks rather than immediate execution. This averages entry prices and provides opportunity to reverse if signals prove false. Target 75% implementation within one week and complete adjustment within two weeks of regime declaration. Faster implementation may be warranted during acute stress when composite scores deteriorate rapidly and consistently across all categories.
Common Pitfalls
Several implementation errors consistently undermine framework effectiveness. Recognition and avoidance of these pitfalls significantly improves outcomes. The most common failure involves selective application where investors follow signals during comfortable periods but override them when they conflict with conviction or recent performance.
Overconfidence in individual indicator expertise creates second-guessing. Investors with deep credit market knowledge may dismiss credit signals as temporary technical factors. Equity specialists may rationalize weak breadth as sector rotation rather than genuine deterioration. The framework's value emerges from systematic aggregation across specialties, not from allowing any single area expertise to override composite assessments.
Another pitfall involves excessive refinement and optimization. Continuously adjusting indicator weights and thresholds to fit recent performance creates overfitting and degrades out-of-sample effectiveness. The framework should undergo periodic review and adjustment based on fundamental changes in market structure, but not frequent optimization to eliminate recent false signals.
Ignoring signals during maximum conviction periods eliminates the framework's value. The strongest temptation to override occurs when everyone agrees on market direction. These are precisely the moments when systematic frameworks provide greatest value by forcing consideration of contrarian indicators.
Reacting to every minor composite score change generates transaction costs exceeding tactical value. Establish minimum score changes and confirmation periods before implementation. Reserve aggressive positioning changes for strong regime signals, not marginal moves in composite scores.
Practical Value for Institutional Investors
"Financial conditions frameworks do not predict the future. They systematically aggregate current information to inform position sizing in ways that improve risk-adjusted returns over complete market cycles."Britannica Capital Research — September 2026
Liquidity and financial conditions dashboards provide institutional investors with systematic approaches to tactical asset allocation that improve risk-adjusted returns without requiring heroic forecasting abilities. The framework's value emerges from disciplined aggregation of independent information sources and rule-based translation of composite signals into portfolio positioning.
Historical evidence demonstrates meaningful Sharpe ratio improvements primarily through drawdown mitigation rather than return enhancement. Investors using the framework avoid or reduce exposure during most major equity market declines while maintaining participation during sustained rallies. This asymmetric outcome profile justifies framework implementation despite imperfect signal accuracy.
Successful implementation requires commitment to systematic application, pre-established implementation rules, and resistance to subjective override during uncomfortable periods. The framework generates greatest value when it conflicts with prevailing sentiment and recent performance, precisely the circumstances when discretionary investors most commonly ignore systematic signals.
Regular Monitoring Cadence
Weekly dashboard updates with monthly comprehensive reviews ensure timely signal detection without excessive noise. Quarterly framework assessments evaluate whether market structure changes require indicator modifications or threshold adjustments. Annual performance attribution analyzes framework contribution to portfolio outcomes.
Integration With Fundamentals
Financial conditions frameworks complement rather than replace fundamental analysis. Economic growth forecasts, corporate earnings trends, and valuation assessments inform strategic allocations. Technical frameworks guide tactical positioning around those strategic views. Combined approaches leverage complementary information sources.
Institutional Governance
Framework implementation requires investment committee buy-in and governance structures supporting systematic application. Pre-established rules documented in investment policy statements prevent subjective override. Regular compliance monitoring ensures actual positioning reflects framework signals according to agreed implementation guidelines.
Based on historical backtests over 2016-2025, institutional investors implementing this framework would have historically tended to experience 0.2-0.4 Sharpe ratio improvement versus passive benchmarks over complete market cycles, with most benefit accruing through reduced maximum drawdowns rather than absolute return enhancement. However, these represent hypothetical results before transaction costs, slippage, and taxes. Actual implementation would have faced: execution delays during volatile periods, bid-ask spreads on rebalancing trades, tax consequences from tactical shifts, and behavioral challenges during high-conviction signals that conflict with consensus. Real-world results would likely have been lower than backtested figures. Future market conditions may differ materially from the historical period analyzed. Success requires viewing the framework as process improvement generating probabilistic edges rather than market timing achieving perfect signal accuracy.